Fig. 6.

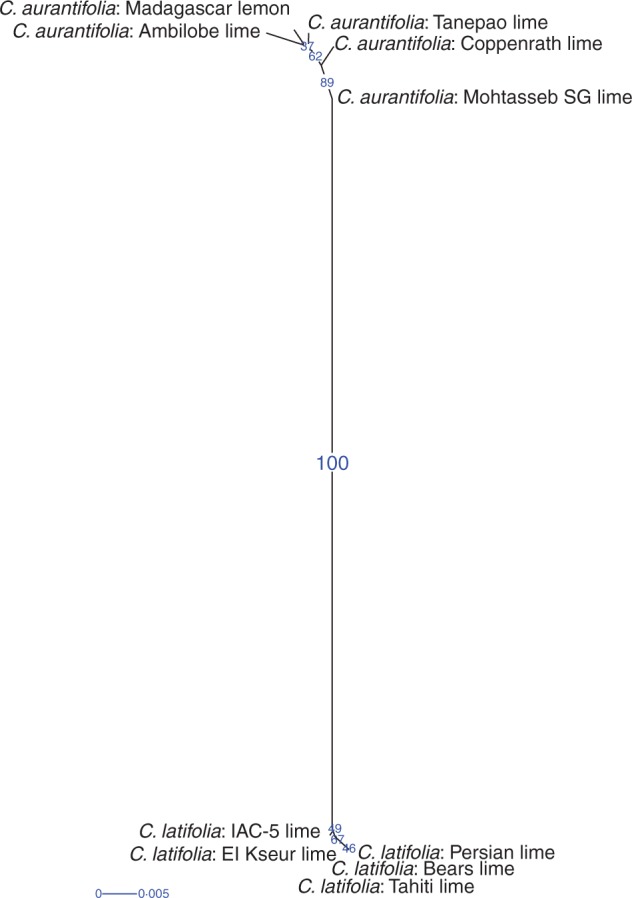
Hierarchical classification of triploid limes using 123 genetic markers. Blue numbers, the bootstrap value given to each edge indicates the frequency of occurrence of this edge in the bootstrapped trees. Blue line, scale of edge lengths.

Hierarchical classification of triploid limes using 123 genetic markers. Blue numbers, the bootstrap value given to each edge indicates the frequency of occurrence of this edge in the bootstrapped trees. Blue line, scale of edge lengths.