
Figure 2.
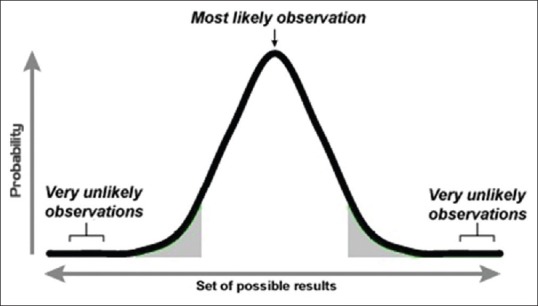
A normal distribution curve with its two tails. Note that an observed result is likely to return a statistically significant result in hypothesis testing if it falls in one of the two shaded areas, which together represent 5% of the total area. Thus, the shaded area is the area of rejection of the null hypothesis