. 2016 Mar-Apr;61(2):174–180. doi: 10.4103/0019-5154.177774
Copyright: © 2016 Indian Journal of Dermatology
This is an open access article distributed under the terms of the Creative Commons Attribution-NonCommercial-ShareAlike 3.0 License, which allows others to remix, tweak, and build upon the work non-commercially, as long as the author is credited and the new creations are licensed under the identical terms.
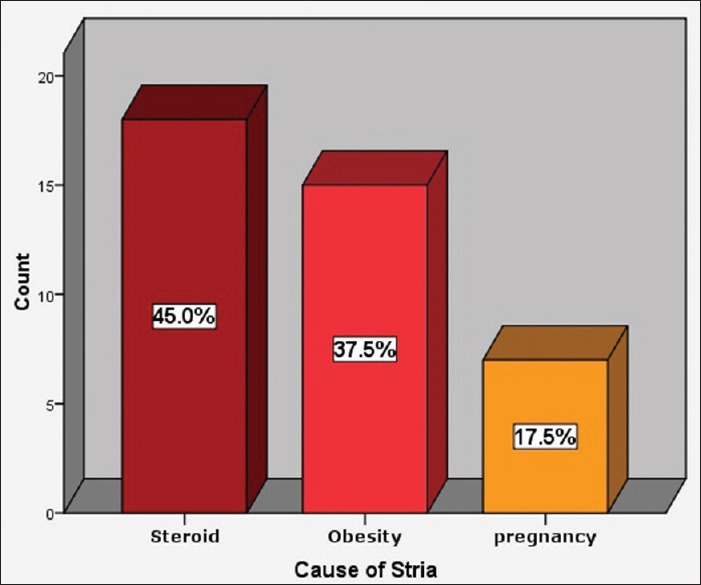
Figure 2.

Distribution of the sample according to the stria etiology
