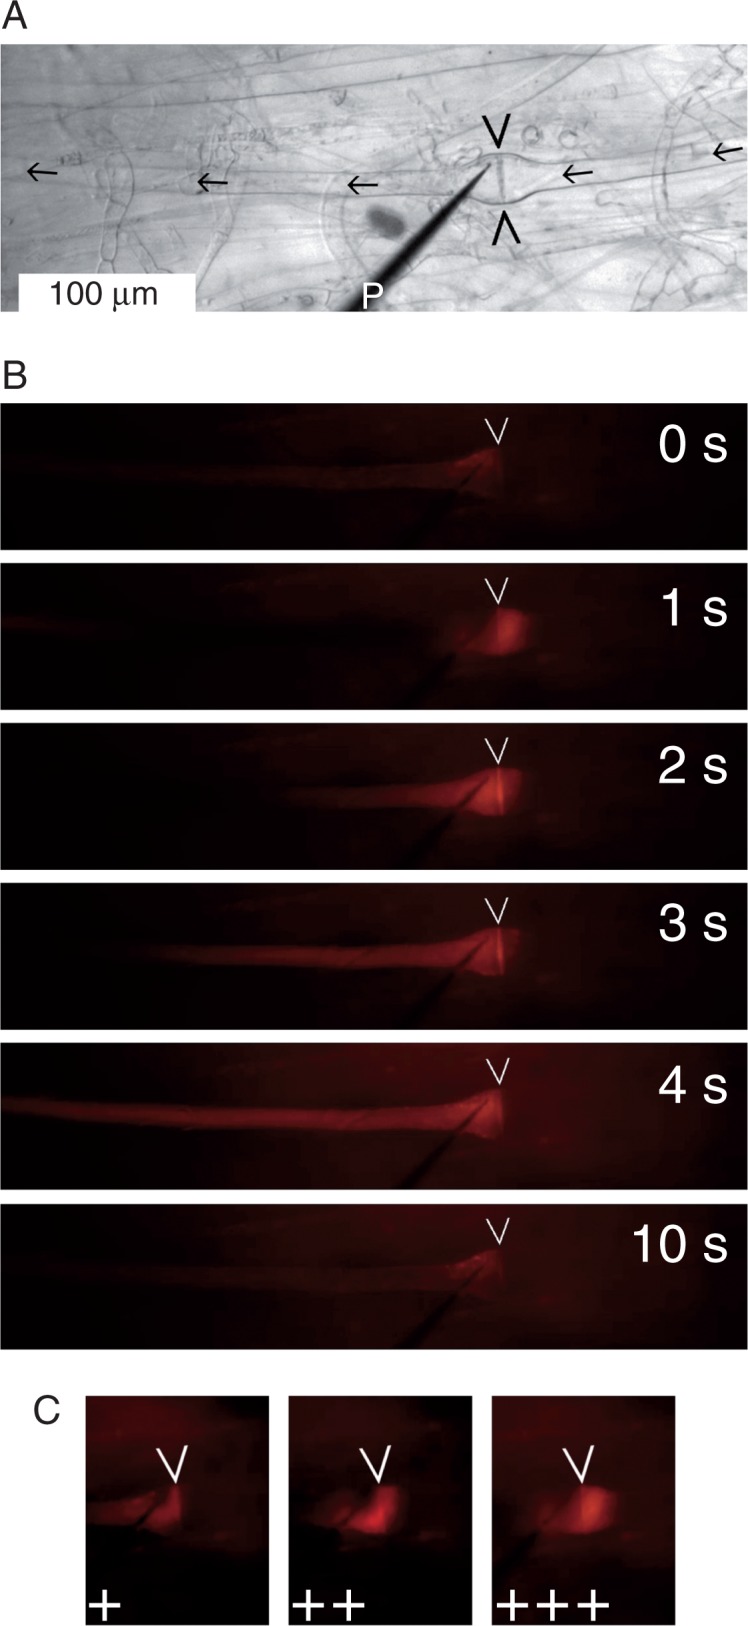
Fig. 4.

Pressure-induced reversal of flow direction across a Nereocystis luetkeana sieve plate (marked by arrowheads on all micrographs). (A) Brightfield micrograph showing the sieve tube (expected flow direction indicated by arrows) and a micropipette (P) for dye injection placed just downstream of the sieve plate. (B) Fluorescence micrographs of the same sieve tube: time course of dye movement following an injection pulse (1·5 s) starting at 0 s. The injection pressure (IP) drives dye upstream across the sieve plate (1 s) before the dye moves back downstream with the sieve tube flow. (C) Dependence of the maximum extent of upstream dye flow on the IP. Three consecutive injection pulses in the same sieve tube are shown (+, low IP; ++, moderate IP; +++, high IP). The complete experiment is presented as Supplementary Data Video S2.
