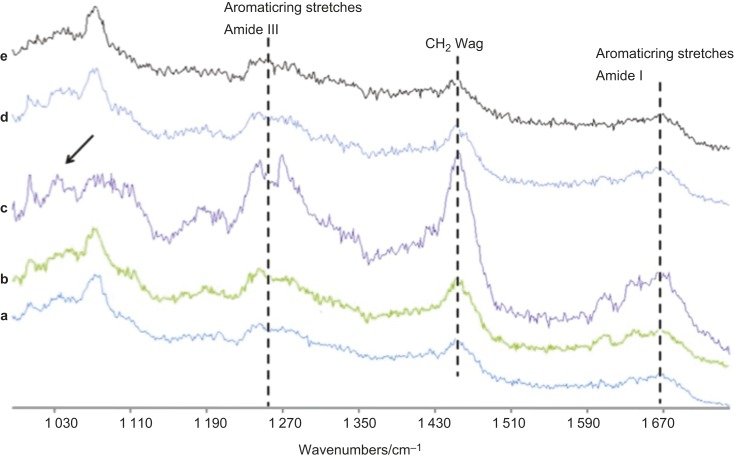
Figure 9.
Comparison of Raman spectral data acquired in the region of 1 030 cm−1 and 1 670 cm−1 at 5 μm levels. (a) Control; (b–e) 1%, 3%, 5% and 10% RF-modified adhesive specimens. The principal bands identified are amide bands (I and III) along with C–H alkyl groups in the resin–dentin specimens. The single arrow indicates the pyridinium ring group where accentuated intensity is observed in 3% RF-modified adhesive specimen. RF, riboflavin.

