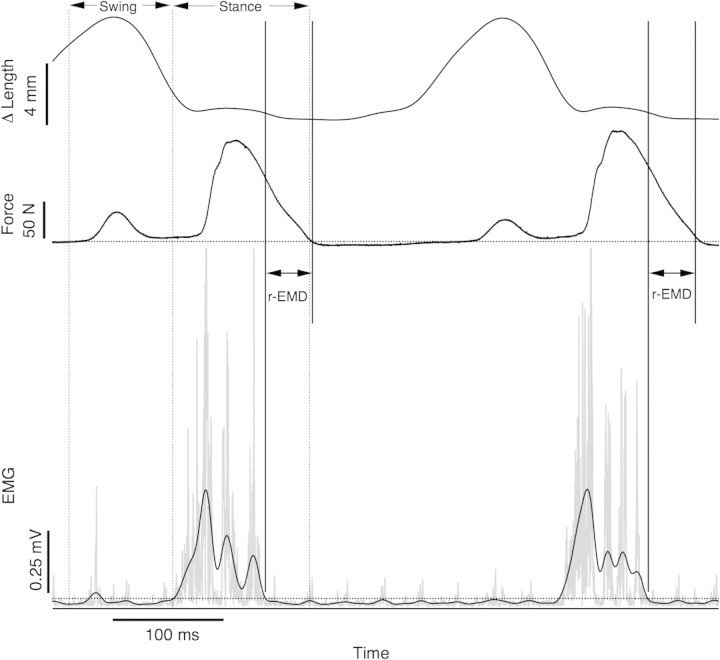
Fig. 1.
Method for determining r-EMD and mean values of EMG and force. Raw EMG signals were bandpass filtered (30,1000 Hz) and full-wave rectified (gray trace). This EMG signal was further filtered with a 30 Hz low-pass filter to produce an envelope signal (black trace, lower panel). A cutoff value (dotted line) was calculated as twice the standard deviation of the EMG over 50 ms of baseline signal. Force (middle panel) cutoff was also determined as twice the standard deviation over baseline values. The time from the end of EMG to the end of force was taken as the r-EMD. The measured length change (top trace) over this period was used to calculate the average velocity. The noisiest of the EMG signals analyzed was used for this sample to illustrate the utility of the threshold method. The regions over which values were averaged for swing phase and stance phase to obtain average values of force and EMG are indicated by vertical dotted lines.

