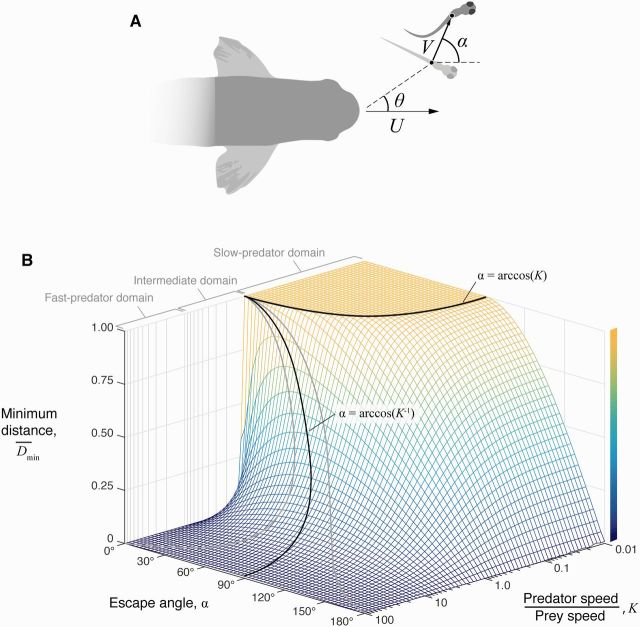
Fig. 2.
A pursuit-evasion model for predator–prey interactions in fish. (A) Pursuit-evasion models consider the motion of a predator (viewed from dorsal perspective) with speed U and a prey with speed V and escape angle α. Some versions of this model consider prey positioned lateral to the predator’s approach (). (B) Numerical simulations were run at varying escape angle and at different speeds of approach by the predator (with ) to examine variation in the minimum distance. The effect of escape angle on minimum distance was found to differ among the slow-predator domain (K < 1), the fast-predator domain (K > 10), and the intermediate domain (1 < K < 10). For the intermediate and fast-predator domains, the optimal angle (black curve) was predicted analytically (Equation (5), based on Weihs and Webb 1984). The effect of deviation from the optimum is indicated by the boundaries of a decrease of (gray curves). In the slow-predator domain, the boundary of the performance plateau where is predicted by Equation (7). (This figure is available in black and white in print and in color at Integrative and Comparative Biology online.)

