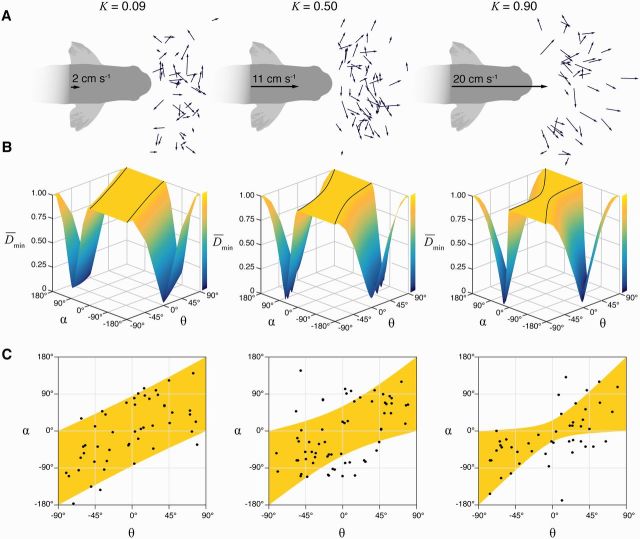
Fig. 3.
Predictions of the model and measurements of the fast-start in the slow-predator domain. The pursuit-evasion model was compared with experiments that recorded the responses of larval zebrafish that were approached by a robotic predator at three speeds (2, 11, and 20 cm s−1) (Stewart et al. 2014). The results of experiments and modeling are arranged in columns that correspond to each of these speeds. (A) The fast-starts are illustrated by the center-of-body displacement over the two stages of the behavior (small arrows). (B) Numerical results of the simulated interactions show how the minimum distance () varies with the escape angle (α) and the initial position (θ0). The plateau region (defined by Equation (11)) shows an area where . (C) This area is plotted with measurements of the initial position and the escape angle of the measured responses shown in (A). (This figure is available in black and white in print and in color at Integrative and Comparative Biology online.)

