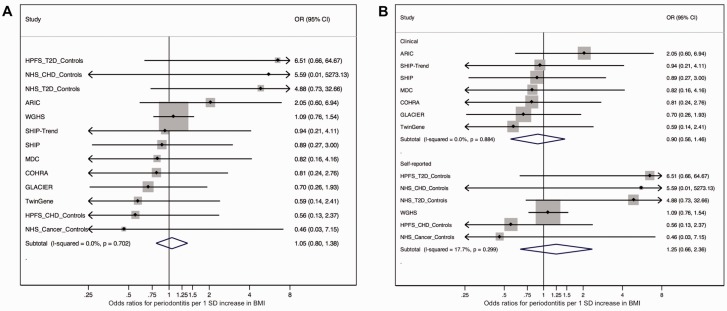
Figure 4.
Meta-analysis forest plots of instrumental variable causal estimates using a genetic risk score (GRS). (A) meta-analysis forest plot including all studies in the analysis; (B) participants divided into 2 subgroups by method of periodontal health data collection. The ORs are for 1 standard deviation unit increase in BMI.

