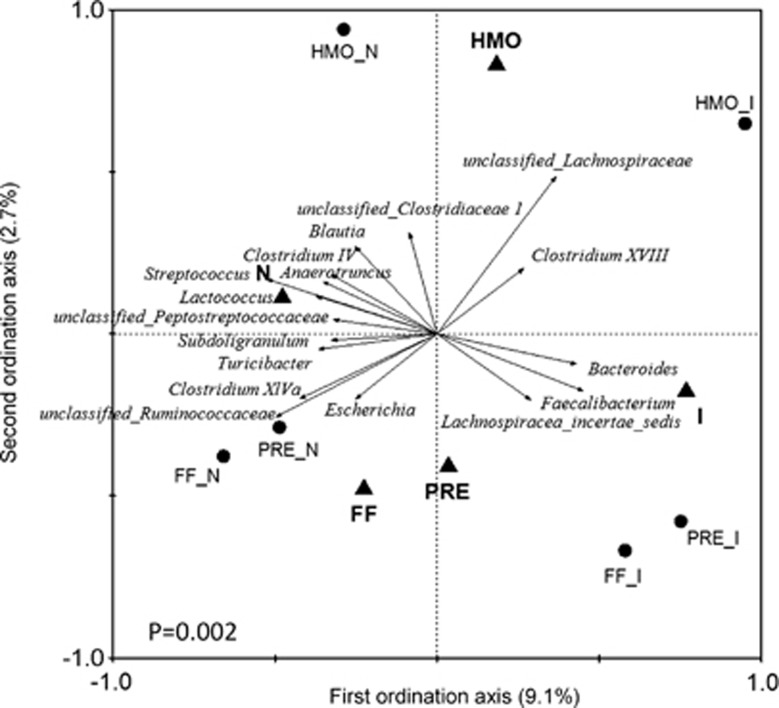
Figure 5.
Triplot of RDA based on genus abundance of gut microbiota relative to RV infection and diet. Nominal environmental variables (infection: I vs N, diet: FF, HMO, PRE) were indicated by triangles. The center of the samples from each group (n=7–13 per group) was indicated by circles. The genera with at least 10% of the variability in their values explained by the first axis are indicated by arrows. P-value was assessed by a Monte Carlo test. FF_N, formula-fed non-RV infected; HMO_N, formula supplemented with human milk oligosaccharides (4 g l−1) non-infected; PRE_N, formula supplemented with short-chain galactooligosaccharides and long-chain fructooligosaccharides (4 g l−1; 9:1) non-infected, FF_I, formula-fed and RV infected; HMO_I, formula supplemented with HMO and RV-infected; PRE_I, formula supplemented with prebiotics and RV-infected.

