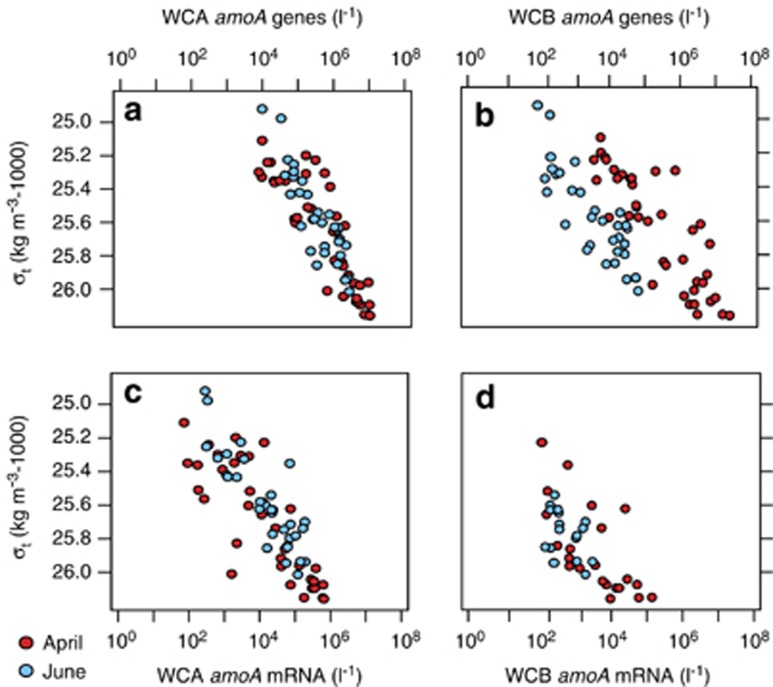
Figure 3.
The distribution and abundance of archaeal amoA genes and transcripts along density surface in Monterey Bay surface waters. (a) WCA and (b) WCB amoA gene abundances plotted along density surface in April (N=41 for both genes) and June (N=32 for both genes). Transcript abundances for (c) WCA amoA (N=37/31 for April/June) and (d) WCB amoA (N=22/17). All data are plotted on the same axis for comparison purposes.

