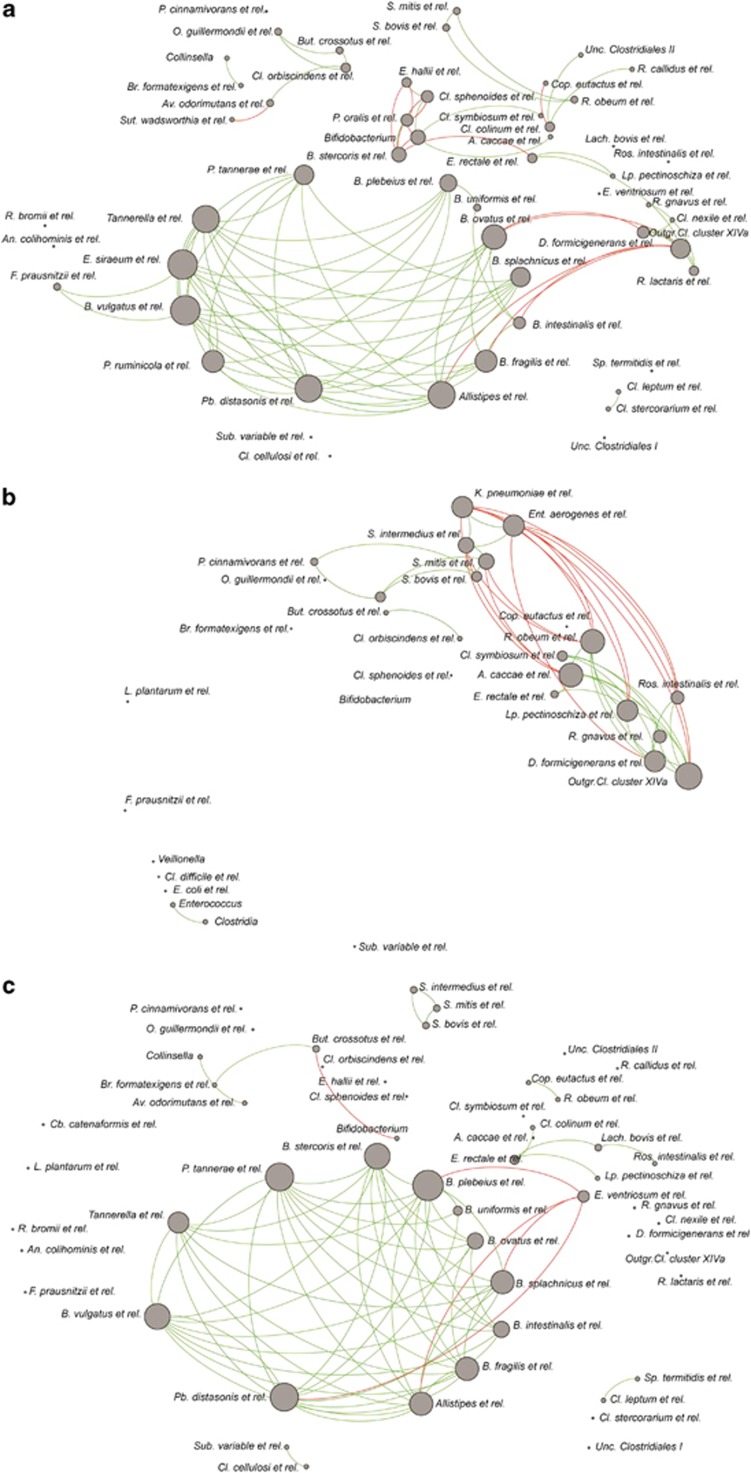
Figure 5.
Bacterial networks of (a) donors, (b) patients before FMT and (c) patients for 5 weeks after treatment. Shown groups with Spearman correlations >|0.8| and relative abundance >0.1% in at least 50% of the samples. Green lines and red lines indicate co- and anti-occurrence respectively (that is, positive and negative correlations).

