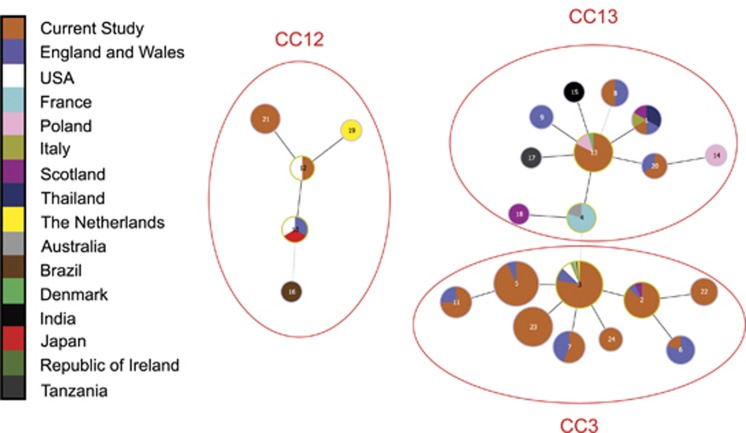
Figure 1.
goeBURST diagram using MLST data from the current study (orange) added to those reported previously (Haynes et al., 2013) to show three clonal complexes (CC3, CC12 and CC13) occurring in England and Wales. Each circle represents a different ST, with lines linking closest relatives. Black lines indicate a single allelic change between STs and grey lines indicate differences at two loci. Larger circles indicate more frequent occurrence and those ringed with a yellow outline indicate putative founder genotypes. Colours within circles show the proportion of isolates of a particular type that were found in the countries indicated in the key. Note that all nine CC3 variants, including four newly characterised STs (21, 22, 23, 24), have been discovered in England and Wales.

