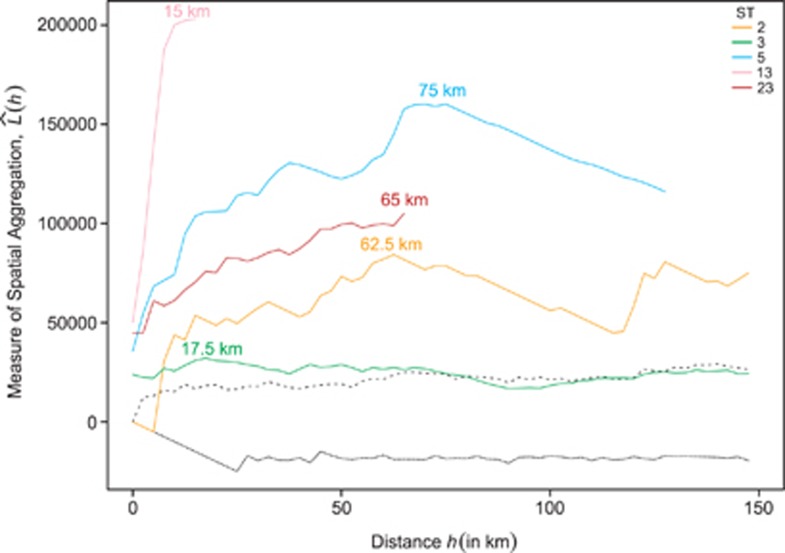
Figure 4.
Estimated number of disease cases within distance h ( ) for five common STs. The distance (h) at which the maximum amount of clustering is observed for each ST is indicated at the peak value of
  for each ST. Broken lines indicate the simulation envelopes above which significant clustering occurs.

