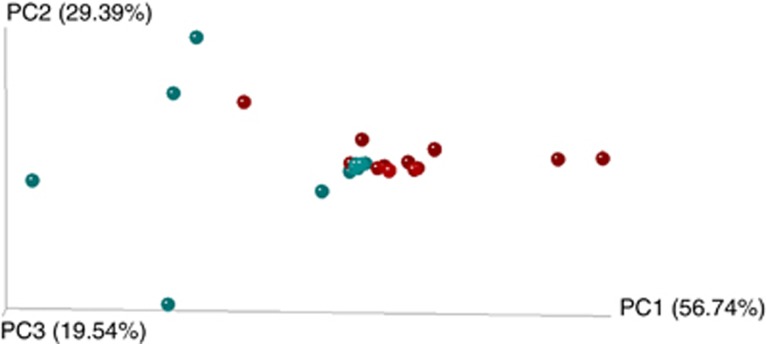
Figure 3.
3D principal coordinates analysis plots generated by Fast Unifrac weighted analysis of four hosts (complete set of samples). Color dots represent the individual samples: red dots represent samples from period 1 (May–June); and blue dots represent samples from period 2 (September). Closer dots represent a higher similarity between the bartonellae infection compositions. The full colour version of this figure is available at The ISME Journal online.

