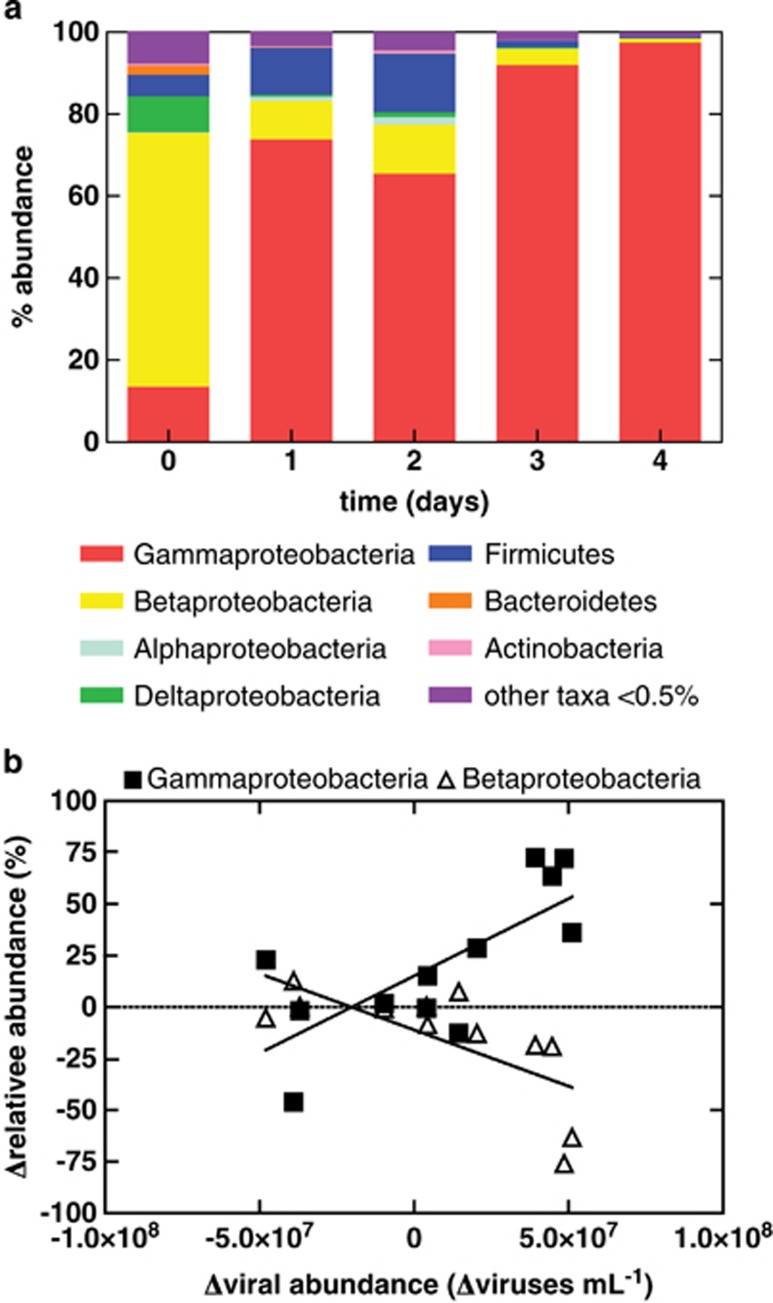
Figure 3.
(a) Taxonomic composition of bacteria within the sediment enrichment over 4 days of incubation. Relative abundance was averaged across all three replicates. Error bars denote s.e.m. ‘Other taxa' represent OTUs with a relative abundance <0.5%. Specific taxa identified are detailed in Table 1. (b) Correlation analyses between changes in the relative abundance of Gammaproteobacteria vs viral abundances (r2=0.5368 and 0.5036) and changes in the relative abundance of Betaproteobacteria vs viral abundances (P=0.0067 and 0.0097).

