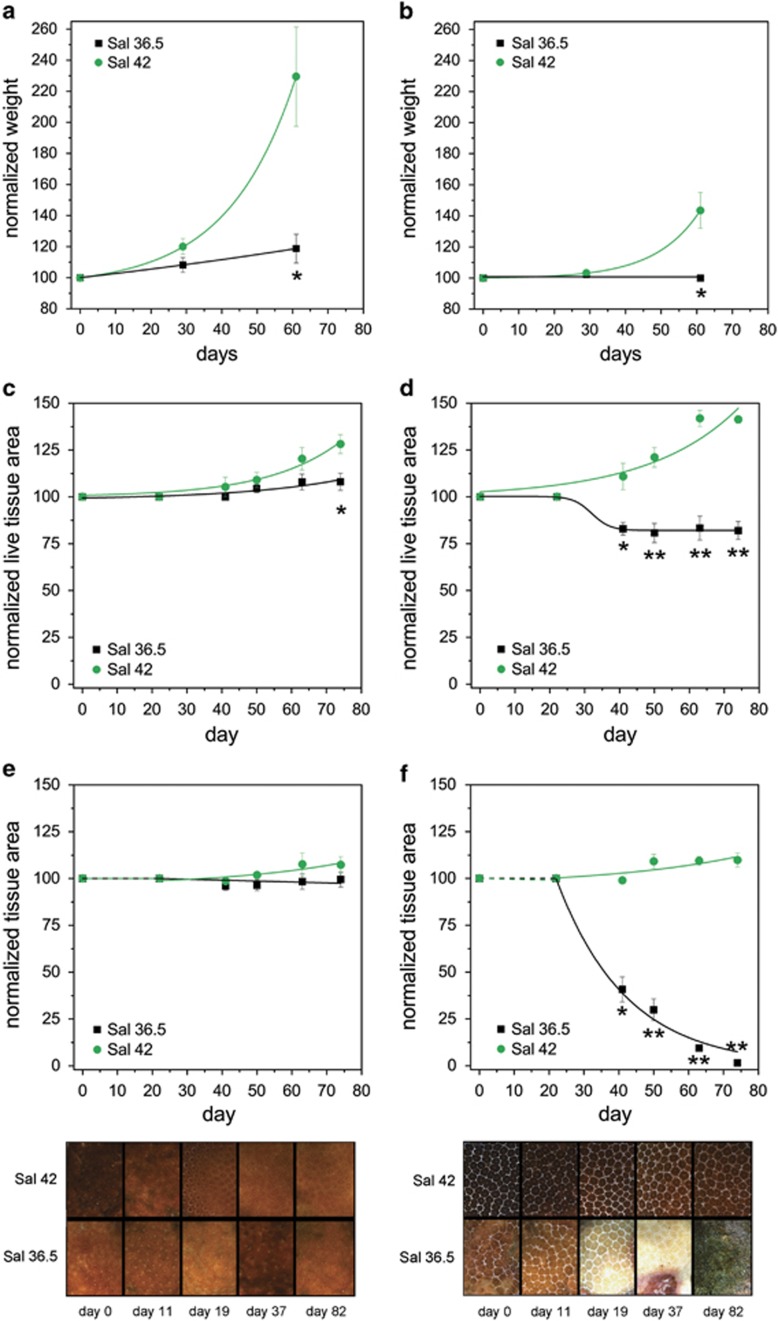
Figure 3.
Effect of reduced salinity on the growth of P. lobata/S. thermophilum associations from the PAG. Growth of replicate colonies of two strains (designated 1 and 2, left and right panels, respectively) of PAG P. lobata/S. thermophilum is shown at high (42) or reduced (36.5) salinity levels. Changes in weight (a and b) and colony surface area (c and d) covered by live tissue were determined in independent experiments. The normalised data represent average values of the corresponding replicates in each experiment, bars denote s.e.m. Lines display theoretical model fittings performed as described in Supplementary Table S1. (e and f) Replicate colonies of PAG P. lobata/S. thermophilum (strains 1 and 2) were acclimated to 36.5 or 42 salinity levels at 27.5 °C. At time point 0, temperatures were slowly ramped up (0.5 °C per day) and the corals were cultured at 32 °C for >2 months. Graphs display the changes in colony surface covered by live tissue. The data points represent the average values. Error bars denote s.e.m. Significant values of P<0.05 or P<0.01 (two sample t-test) are indicated with one or two asterisks, respectively, below the corresponding experimental values. After an initial lag phase of ~3 weeks (dashed lines), the data could be fitted (full lines) as described in Supplementary Table S1. Representative micrographs of replicate colonies (lower panels) illustrate the time course of differential responses of strains 1 and 2.

