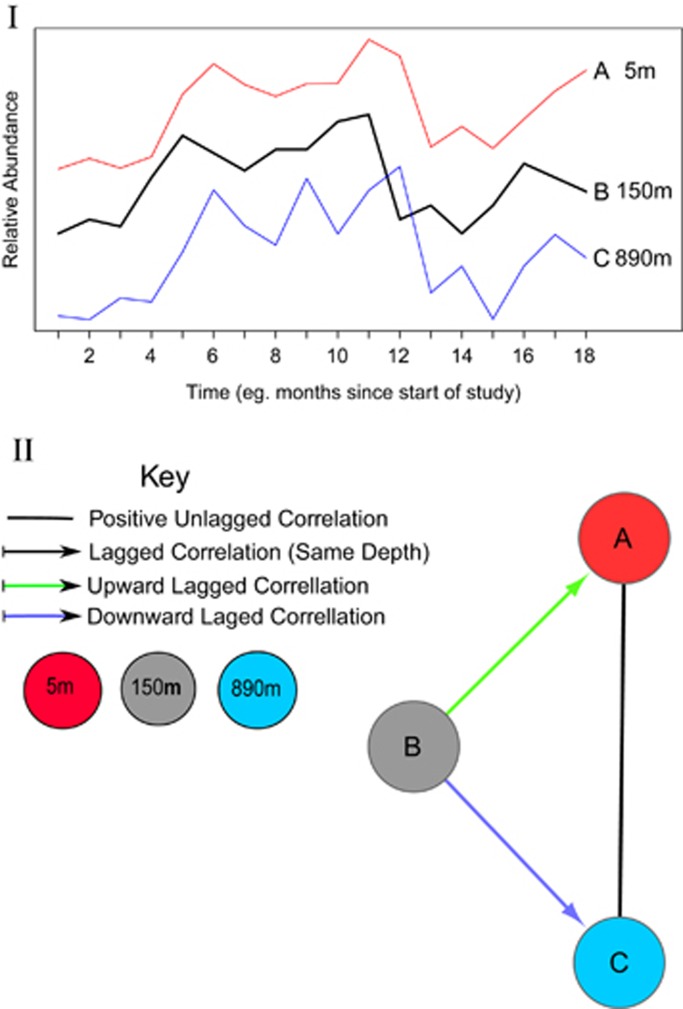
Figure 1.
An example of a time-lagged correlation between OTUs at different depths. I. Three hypothetical organisms that change in abundance over time. Note that (B), located at 150 m, leads both OTUs A (at 5 m) and C (at 890 m). The correlation between A and B is ‘upward' because the deeper node, leads the shallower node. The correlation between B and C is ‘downward' because the shallower node leads the deeper node. The correlations between A and C is ‘unlagged' because both changes happen at the same time. II. A network showing correlations between all pairs of parameters.

