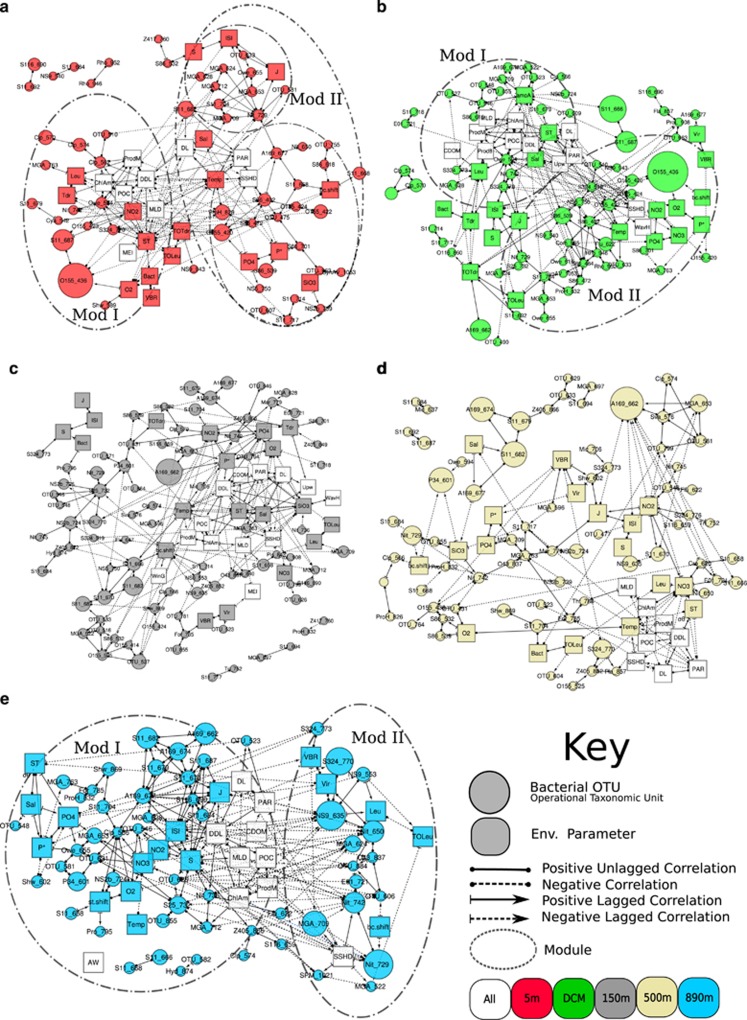
Figure 3.
Association network showing statistically significant, time-lagged and non-time-lagged correlations between bacterial and environmental nodes at each depth (a, 5 m; b, DCM; c, 150 m; d, 500 m; e, 890 m). Nodes represent bacterial OTUs (circles) and environmental parameters (squares) at each depth. Shown are bacteria that occur at least 25 times and associations that have lagged Spearman correlations such that |ρ|>0.55, P<0.01, Q<0.05. Node identities are indicated in Supplementary Table S1. Modules, clusters of highly connected nodes, are circled. In all cases, Mod I corresponds to the module with nodes connected to high surface chlorophyll_a and increasing daylight (spring bloom) and Mod II corresponds to nodes that are correlated positively to each other and negatively to nodes in Mod I.

