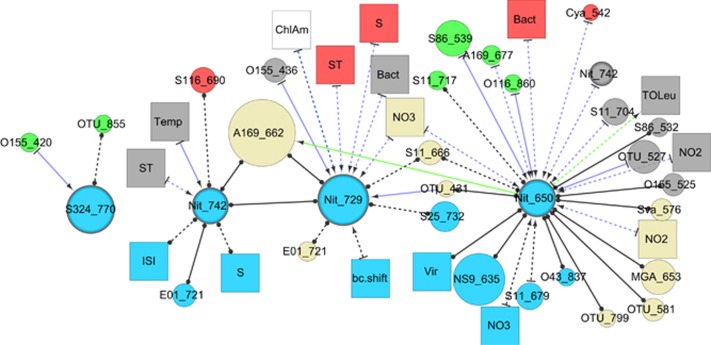
Figure 4.
Association network of correlations between Deltaproteobacteria OTUs at 890 m and other bacteria and environmental parameters found at every depth throughout the water column. All bacteria shown have a mean abundance of greater than 1% and are found with a relative abundance of greater than 0.01% in more than 36 samples. Edges represent statistically significant, potentially time-lagged correlations (Spearman's |ρ|>0.57, P<0.01, Q<0.05). Abbreviated names are followed by OTU fragment size. Node sizes of bacterial nodes represent the average abundance of OTUs. Abbreviations for the nodes are translated in Supplementary Table S1.

