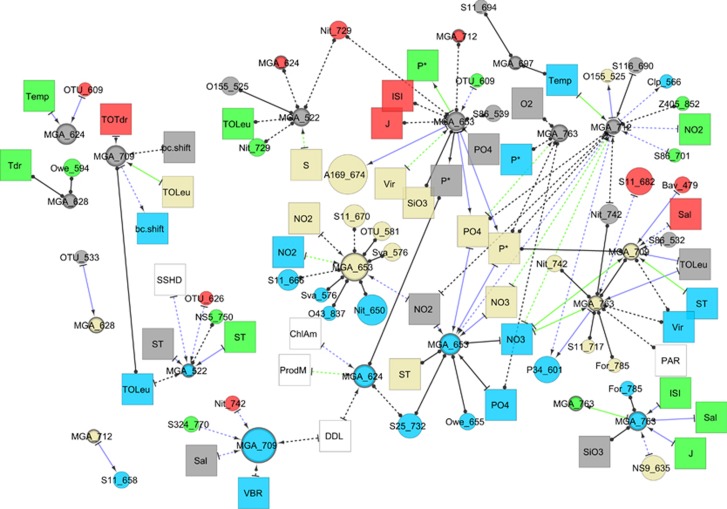
Figure 5.
Association network of correlations between bacteria from the Marine Group A phylum at 150 m, 500 m and 890 m and other bacteria and environmental parameters found at every depth throughout the water column. Nodes and edges have the same thresholds (ρ, P and Q values for edges, mean abundance and occurrence thresholds for bacterial nodes) as in Figure 4.

