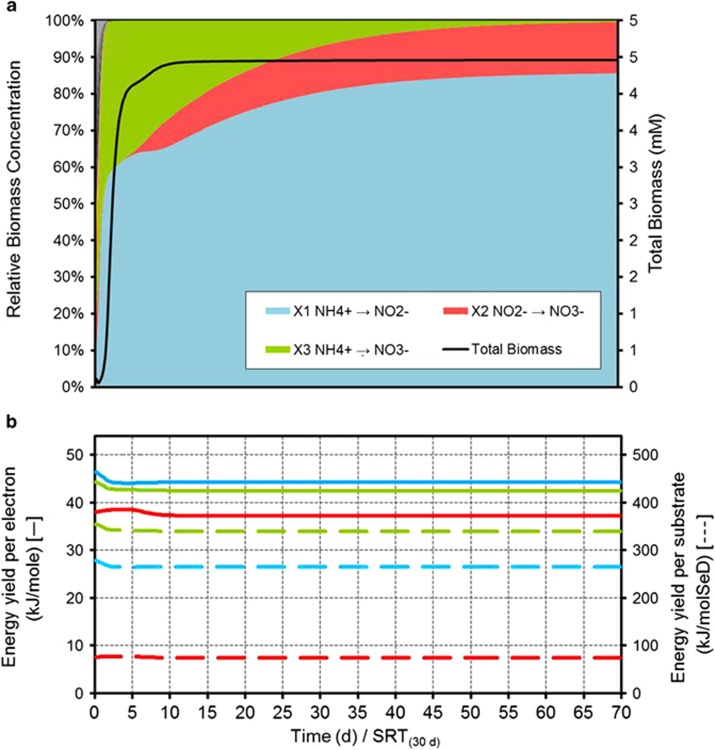
Figure 3.
Simulated dynamics of the microbial ecosystem during autotrophic nitrogen oxidation. (a) Evolution of the microbial population in total biomass and relative abundance terms. (b) Catabolic energy yield per mol of electron transferred throughout the catabolic reaction (solid line) and catabolic energy yield per mol of substrate (dashed line).

