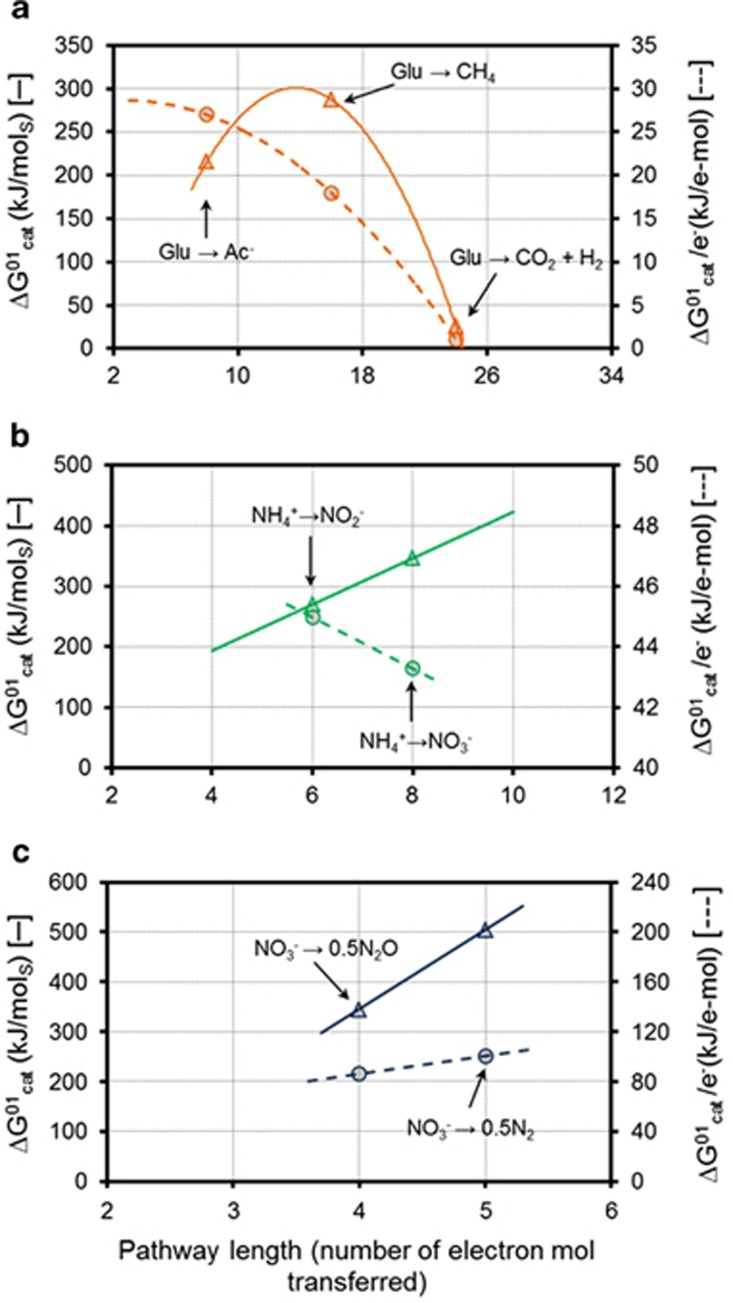
Figure 5.
Theoretical energy yield per mol of substrate (triangles) and per mol of electron transferred (circles) with respect to pathway length for (a) glucose fermentation; (b) nitrification and (c) denitrification. (ΔG01 values are presented in Table 1; for denitrification case, ΔG01 is referred per mol of NO3−).

