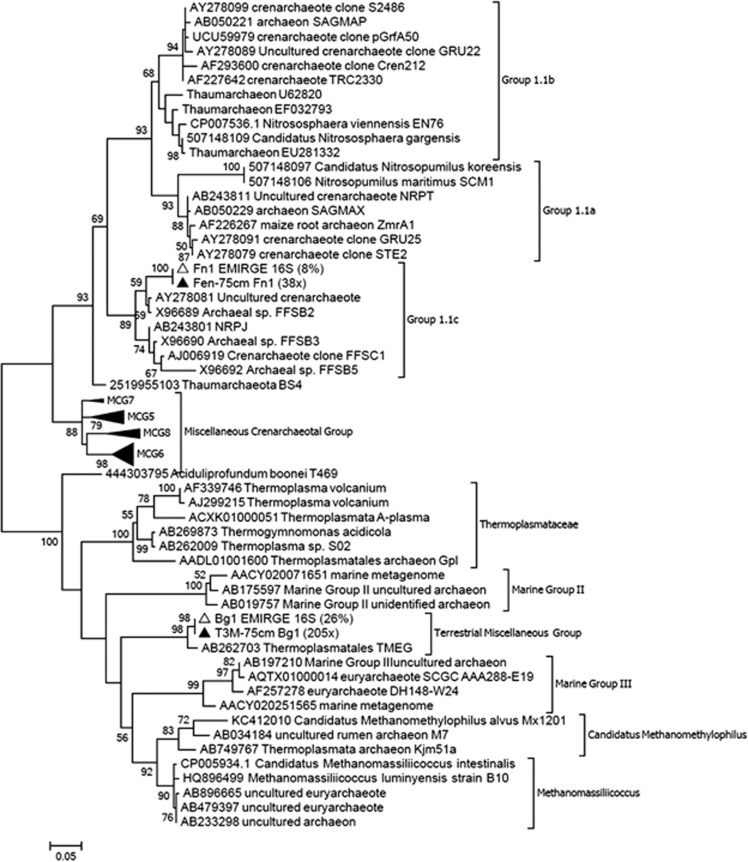
Figure 1.
Maximum likelihood tree based on SSU rRNA gene sequences. Solid triangles, sequences retrieved from assembled contigs; open triangles, sequences reconstructed by EMIRGE (Expectation maximization iterative reconstruction of genes from the environment, see Supplementary methods). Numbers in parentheses indicate the percentage of sequences or read coverage.

