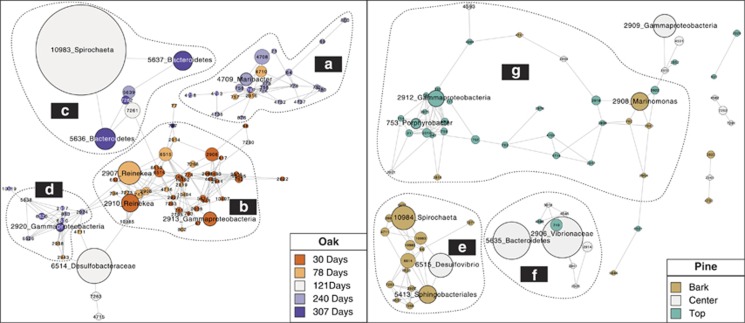
Figure 6.
Network showing associations between OTUs identified by maximal information coefficient values. Nodes represent abundant OTUs. Numbers indicate OTU names. Taxonomic assignment is given for the largest OTUs. Node size is proportional to the number of sequences in each OTU. The left panel presents the oak sample network from the aquarium and the right panel represents the pine samples from the aquarium. Dashed lines delineate subclusters defined by the HC-PIN algorithm. Colors indicate OTUs typical for the different incubation times or microhabitats. a–g indicates subnetworks discriminated by the HC - PIN analysis.

