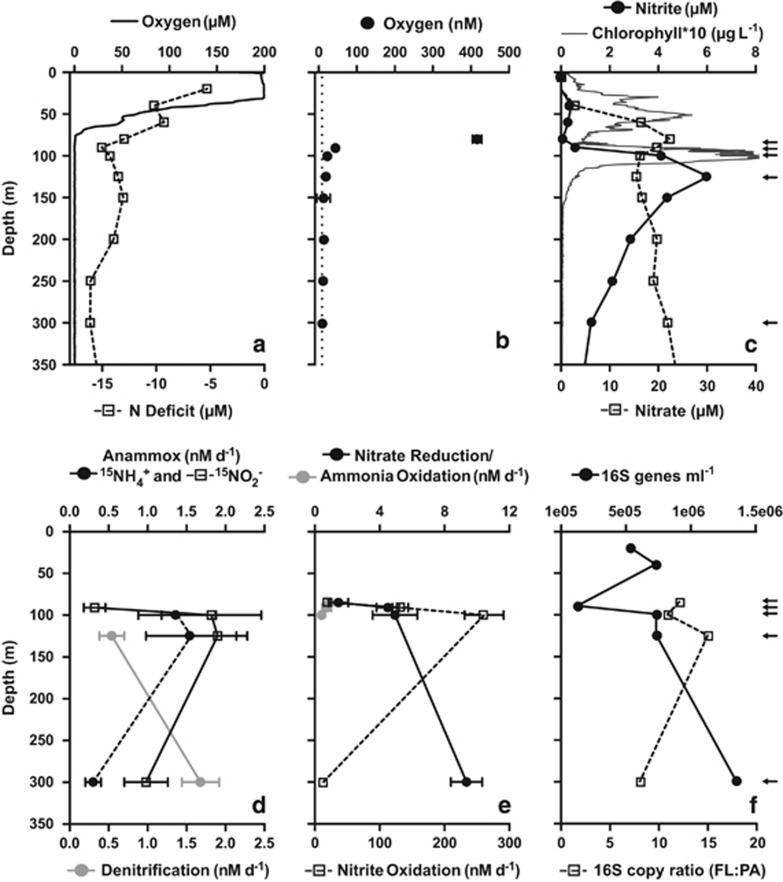
Figure 1.
Vertical profiles of hydrochemical parameters, bulk N cycling process rates and bacterial 16S rRNA gene counts at Station 6, off Manzanillo, Mexico on 19 June 2013. The N deficit (a, open squares) is shown relative to oxygen concentrations, measured during the upcast profile with both a SBE43 sensor (a; solid line) and STOX sensors (b), and to profiles of nitrite, nitrate and chlorophyll concentration (c). The dashed line in b indicates the detection limit of the STOX sensors (~9 nm). N cycle process rates (d, e) are bulk rates (no size fractionation) in nM N per day. (f) Quantitative PCR-based counts of 16S rRNA gene copies per ml of bulk seawater (all biomass >0.2 μm) and the ratio of gene counts in the FL (0.2–1.6 μm) biomass fraction to counts in the PA (1.6–30 μm) fraction. Arrows (c, f) indicate the depths sampled for rate measurements. Error bars represent the standard error.

