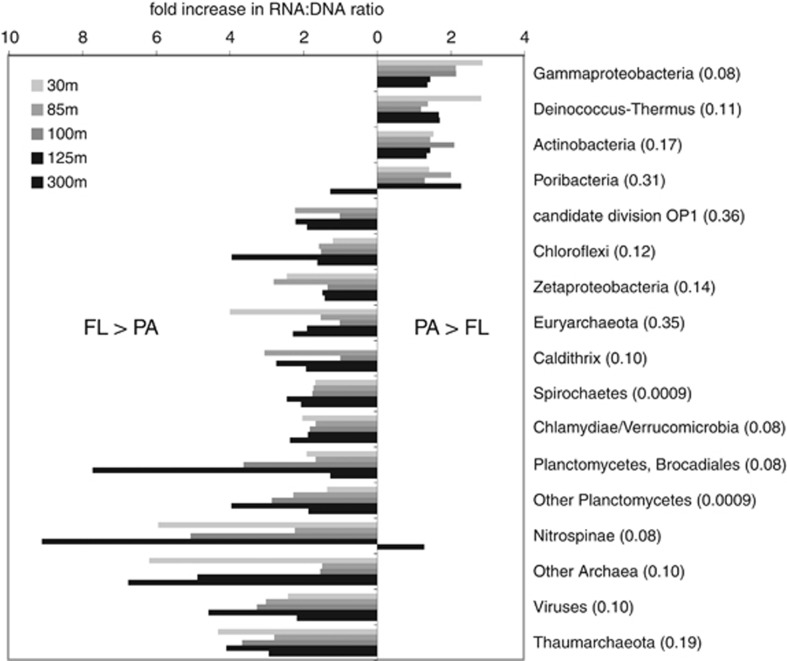
Figure 4.
Fold increase in taxon RNA/DNA ratios between PA (1.6–30 μm) and FL (0.2–1.6 μm) communities. Plot shows the fold increase in ratios for major taxonomic groups identified by the NCBI annotations of protein-coding genes and transcripts in coupled metatranscriptome and metagenome data sets. Values right of zero indicate higher ratios in PA communities (PA/FL>1). Values left of zero indicate higher ratios in FL communities (FL/PA>1). The plot shows only groups with relative abundance in metagenome data sets greater than 0.2% of total sequences, and only groups with an average (across all five depths) fold increase >1.5. Numbers in parentheses are false discovery rate q-values for t-test comparisons of PL and FL ratios, calculated as in Storey and Tibshirani (2003).

