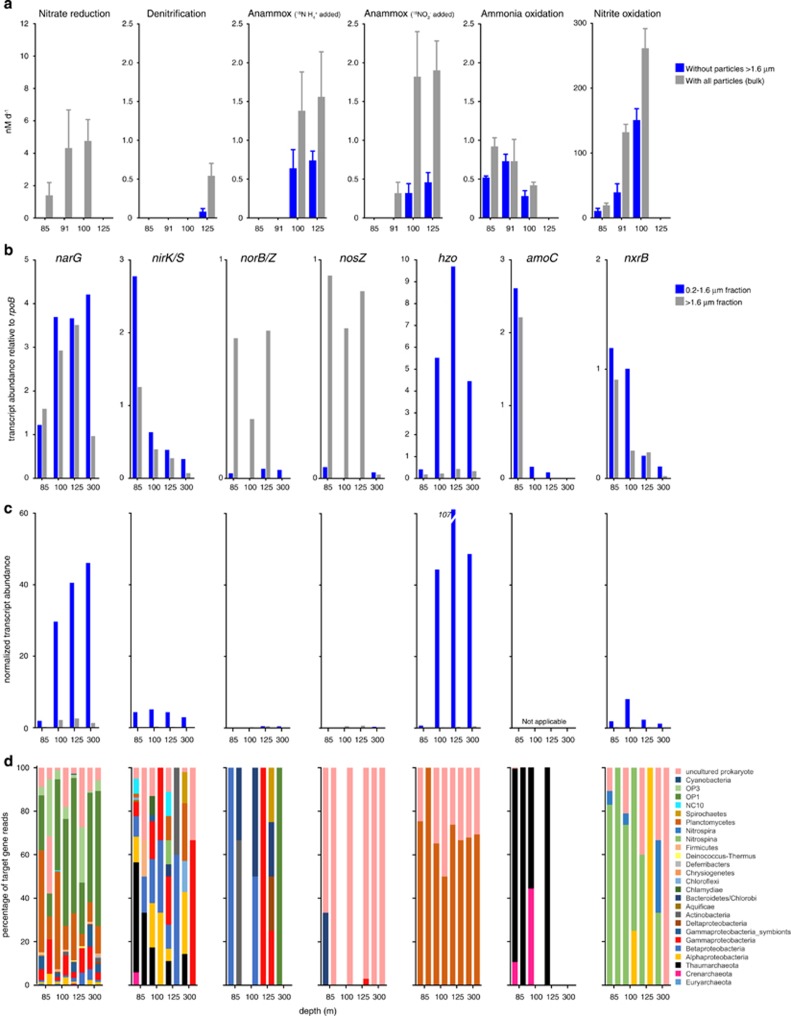
Figure 5.
Measured rates and marker gene transcript levels for major dissimilatory N cycle processes. Process rates (a) are shown for incubations with particles (no filtration) and without particles measuring 1.6 μm or larger. Zero values indicate non-significant rates and error bars represent the standard errors. Note variation in y axis scales. (b) Marker gene transcript abundances in FL (0.2–1.6 μm) and PA (1.6–30 μm) filter fractions. Abundances are calculated as read count per gene per kilobase of gene length, and shown as a proportion of the abundance of transcripts matching the universal, single-copy gene rpoB. A value of 1 indicates abundance equal to that of rpoB. Note variation in y axis scales. (c) Multiplies the values in b by the counts of bacterial 16S genes in Figure 1f and the FL/PA ratio (for FL counts only), with the values then divided by 1 000 000 for presentation. The resulting values do not reflect absolute counts, but provide an approximation of how variation in bacterial abundance (inferred by proxy from 16S counts) is predicted to affect comparisons of absolute transcript counts across samples, assuming that absolute transcript counts scale with bacterial load. Scaled amoC values are not provided in c, as FL:PA ratios were determined using bacterial-specific primers, and amoC transcripts were dominated exclusively by archaeal sequences; FL/PA ratios do not reflect archaeal contributions. Patterns in c should be interpreted cautiously, as they could change if RNA content per unit biomass varies substantially among samples. (d) The taxonomic affiliations of marker gene transcripts based on NCBI annotations of genes identified as top matches (> bit score 50) via BLASTX.

