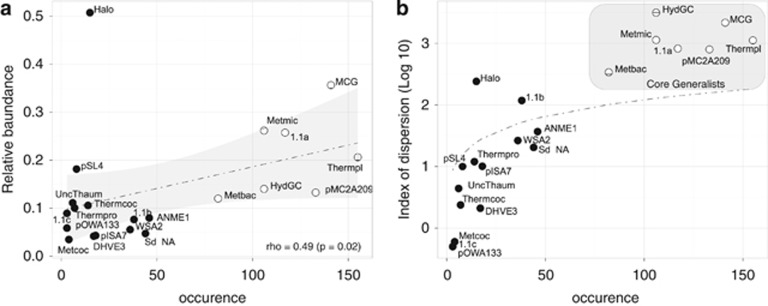
Figure 1.
Species abundance distribution (SAD) pattern of archaeal classes in the clone libraries analyzed. (a) Occurrence of archaeal lineages (number of studies in which a given lineage was found) plotted against its average abundance across these studies. A significant positive distribution–abundance relationship is observed. Core lineages (in white) were defined as those appearing in >75 studies and satellite lineages (in black) occurred in less than 50 studies. (b) Occurrence of each archaeal lineage plotted against its dispersion index. The line depicts the 2.5% confidence limit of the χ2 distribution: lineages falling bellow this line follow a Poisson distribution and are randomly dispersed in space. ANME, anaerobic methanotroph; DHVE3, Deep Hydrothermal Vent Euryarchaeota-3; Halo, Halobacteria; MCG, Miscellaneous Crenarchaeotic Group; Metbac, Methanobacteria; Metmic, Methanomicrobia; Metcoc, Methanococci; SAGMEG, South African Gold Mine Euryarchaeotic Group; Thermcoc, Thermococci; Thermprot, Thermoprotei; Thermpl, Thermoplasmata; UncThaum, Uncultured Thaumarchaeota; 1.1a, Thaumarchaeota 1.1a; 1.1.b, Thaumarchaeota 1.1b; 1.1.c, Thaumarchaeota 1.1c.

