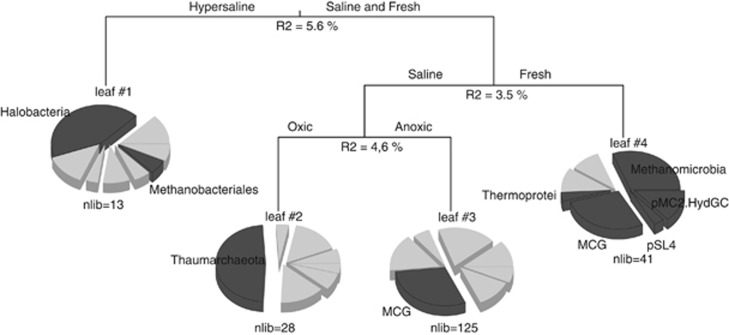
Figure 2.
Multivariate Regression Tree (MRT) relating the abundance of each archaeal lineage to environmental variables. The model explained 13.7% of the total variance of the taxonomic composition of archaeal communities. Pies under each leaf represent the mean of normalized archaeal lineage abundance for each lineage significantly correlated with environmental parameters. Dark grey sections identify significant indicator lineages according to the IndVal index calculated on each leaf (P<0.01). nlib=number of clone libraries.

