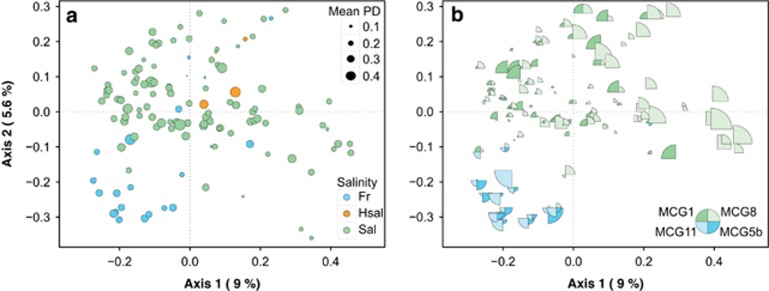
Figure 4.
(a) Principal coordinate analysis (PCoA) plot obtained using a weighted UniFrac distance matrix calculated on 140 clone libraries containing >10 representative MCG sequences (97% cutoff). Libraries are colored according to salinity (see legend). Bubble size indicates the mean phylogenetic diversity (PD) index of 1000 randomized subsamples of each study. (b) Same as in a, but showing the relative abundance of MCG-IL (size of sectors) with the highest IndVal values in each study (MCG-1 and MCG-8 in green for marine sediments; MCG-5b and MCG-11 in blue for freshwater sediments).

