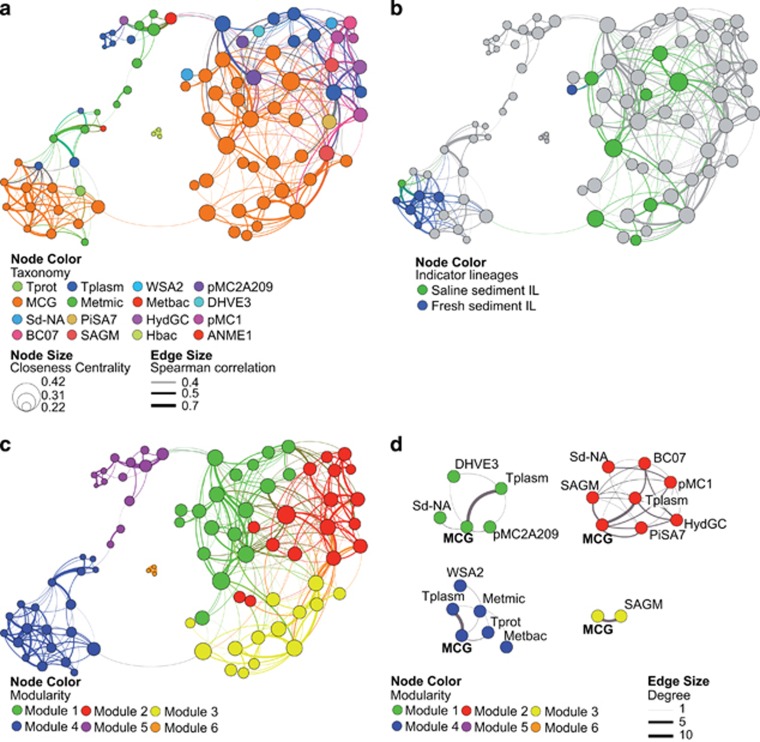
Figure 7.
(a) Co-occurrence OTU network based on correlation analysis. Each node denotes an archaeal OTU 90%. Node size is proportional to the closeness centrality (that is, the average shortest path of this node to any other node) and node color denotes taxonomic classification (see Figure 2 for abbreviations). Edge lines between nodes represent significant co-occurrences relationships. Edge size indicates the strength of Spearman correlation among nodes. (b) Same network as in a, but nodes are colored according to MCG-Indicator Lineages, as follows: green: indicator MCG lineages for saline sediments (MCG-1, MCG-3 and MCG-8); blue: indicator MCG lineages for freshwater sediments (MCG-5a, MCG-5b, MCG-7, MCG-9 and MCG-11). (c) Same network as in a, but nodes are colored by modules. (d) Sub-network modules clustering all OTUs of the same lineage colored by modularity. Edge size indicates the number of connections (degree). Only the sub-networks where MCG are present are displayed.

