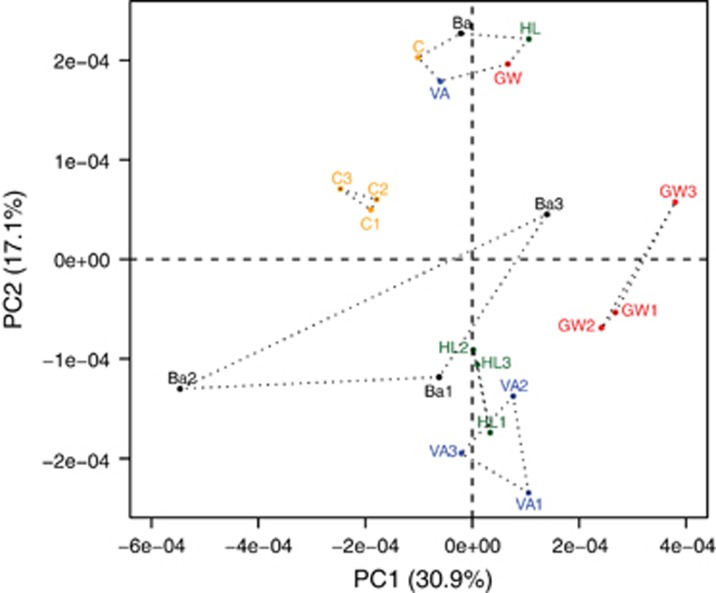
Figure 4.
Results from principal component analysis of mass to charge ratios (m/z) that derived from ESI-MS. The first and second principal component explained 30.9% and 17.1% of the variability, respectively. Samples from both the beginning (not numbered) and end (numbered) of the experiment are visualised. Numbers depict replicates one, two and three. Hulls were drawn to group not only the replicates within a treatment but also the samples at the beginning of the experiment. Abbreviations: Ba, Baltic; C, control; GW, groundwater; HL, headwater lake; VA, Vindelälven.

