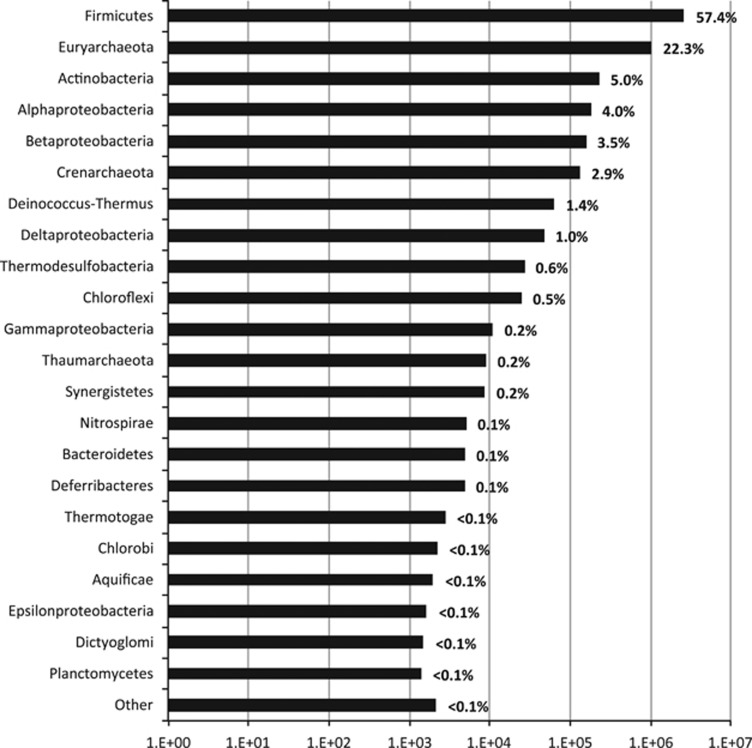
Figure 2.
Relative abundance of single copy protein encoding genes (SC-PEGs). The phylum (y axis) level abundances (x axis) of SC-PEGs are displayed. The percent relative abundance of each phylum is shown at the end of each bar. The following phyla are included in the ‘Other' designation: Korarchaeota, Acidobacteria, Chlamydiae, Fusobacteria, Fibrobacteres, Tenericutes and Cyanobacteria.

