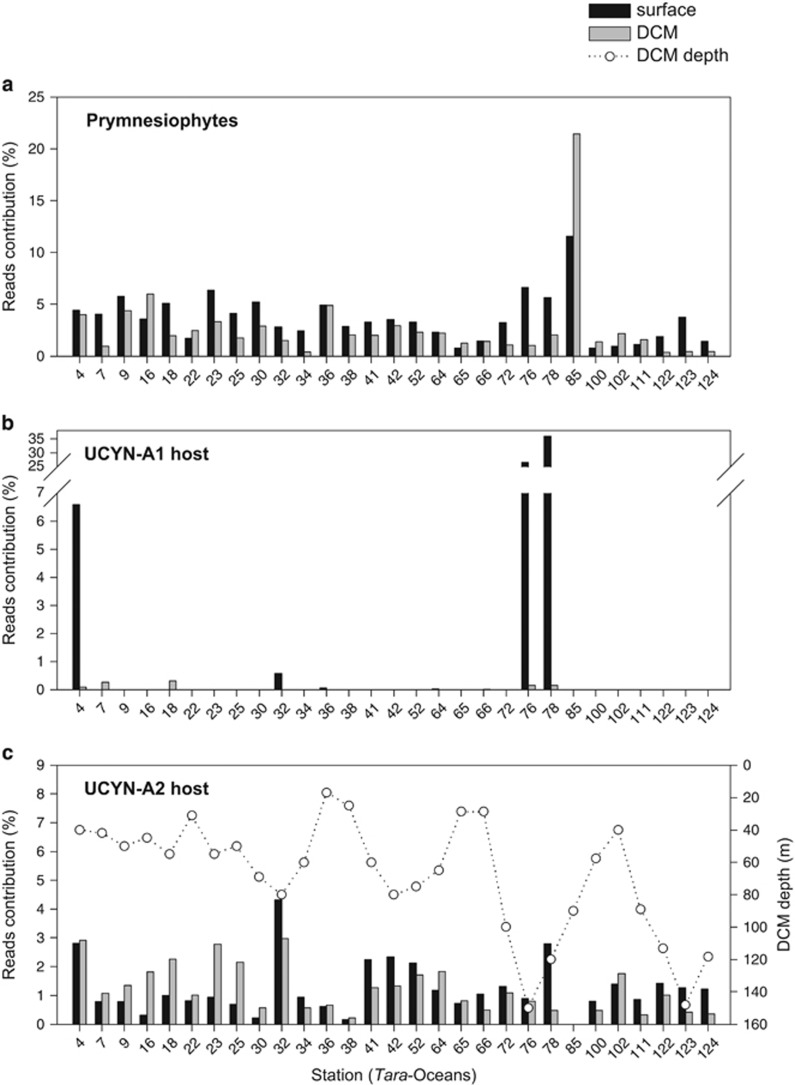
Figure 4.
Contribution of prymnesiophytes to total community reads (a) and contribution of UCYN-A1 host (b) and UCYN-A2 host (c) to total prymnesiophyte reads at surface and DCM depths of Tara-Oceans stations (V9 rDNA metabarcoding data). DCM depth was plotted in panel (c). Only stations having both surface and DCM samples are shown (29 out of 40). In the 11 stations not shown here, the percentage of prymnesiophytes to total community reads at surface was similar (4.6%±4.3 on average).

