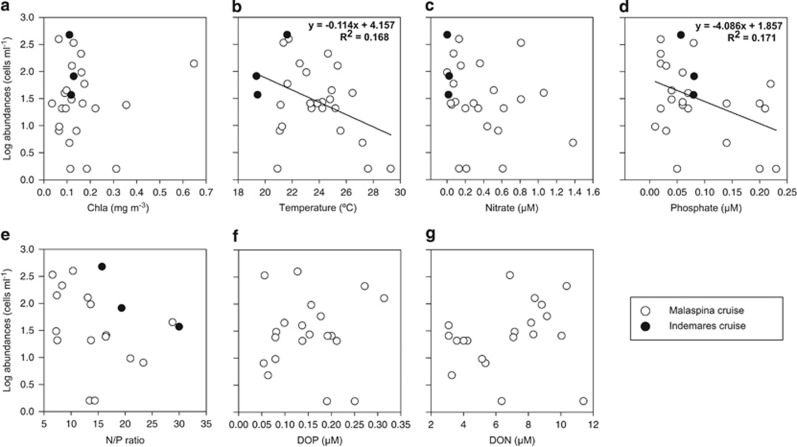
Figure 5.
Cell counts of the prymnesiophyte–UCYN-A1 symbiosis versus (a) total chlorophyll, (b) temperature, (c) nitrate, (d) phosphate, (e) N/P ratio, (f) dissolved organic phosphorus (DOP) and (g) dissolved organic nitrogen (DON) measured in surface waters during the MALASPINA (white dots) and INDEMARES (black dots) cruises. Regression lines are plotted in cases displaying a significant relationship (P<0.05).

