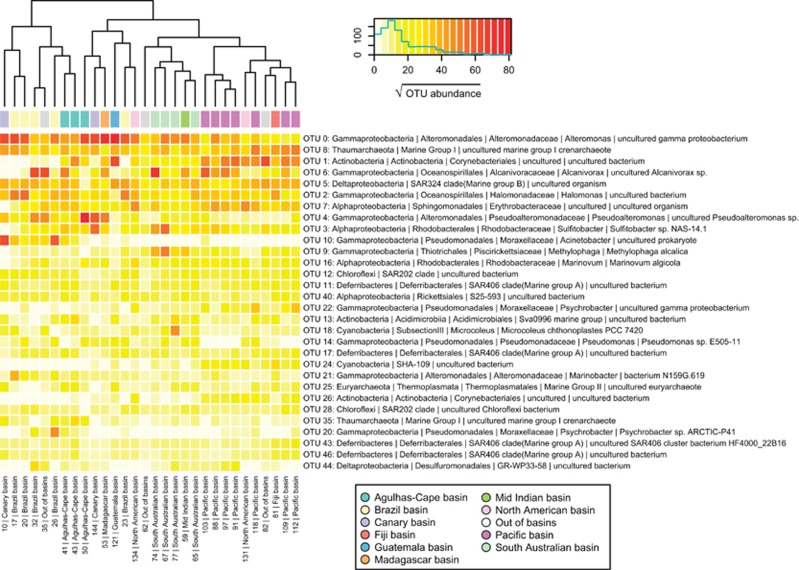
Figure 3.
Heatmap representing the square root of abundances (number of reads) of the 30 most abundant OTUs (rows) along the 30 stations (columns). Subsampled abundances to the minimum sequencing depth (10 617 reads per sample) have been used for comparison and data from the two size fractions within a station was summed after subsampling. The deep-oceanic basins to which each station belongs are indicated at the top (see color legend). Taxonomical annotation for each OTU is based on the SILVA taxonomic assignment of each OTU representative sequence. OTUs are ordered top to bottom based on their global abundance in the whole data set.

