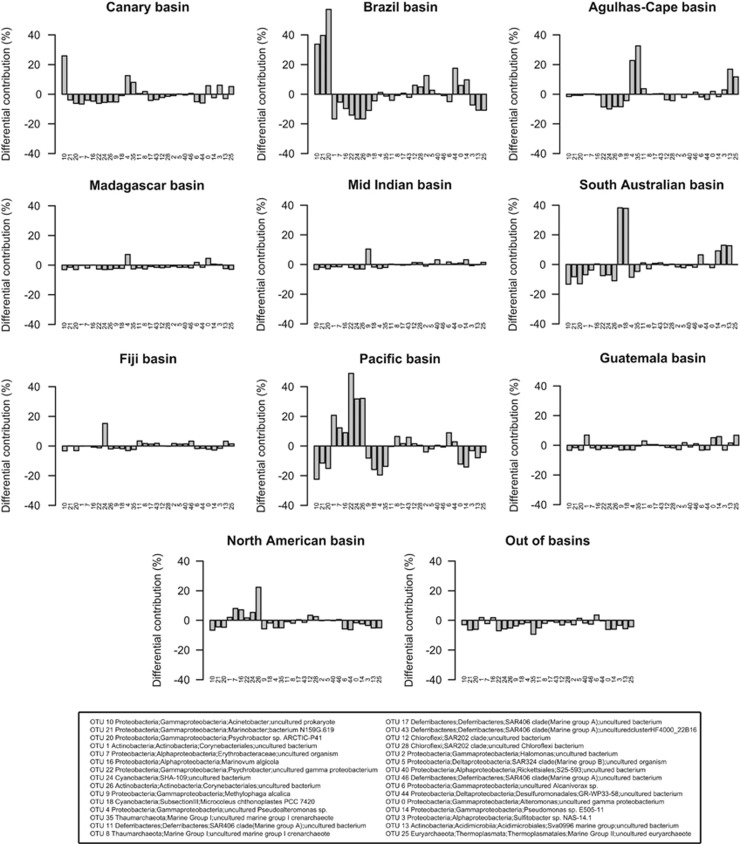
Figure 4.
Differential contribution (Di,b; in %) of each basin to the total abundance of each of the 30 most abundant OTUs (see Supplementary Information for calculation details). Numbers below each bar represent each OTU, whose taxonomical affiliation is described in the legend, based on SILVA taxonomy. OTUs are the same as in Figure 3 but ordered using a clustering based on Di,b values (details not shown) for a clearer visualization.

