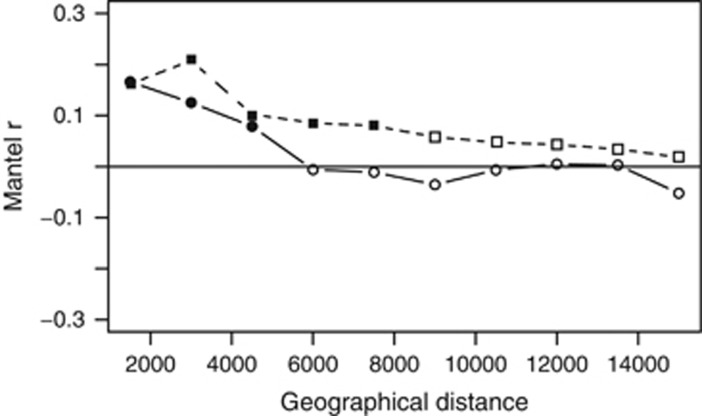
Figure 6.
Mantel correlogram for particle-attached (squares) and free-living (circles) prokaryotic communities testing the autocorrelation on community composition by performing sequential Mantel tests between the Bray–Curtis dissimilarities and the grouping of samples using geographical distance classes set at 1500 m. Filled points represent significant correlations after Bonferroni correction. Mantel correlograms were run up to a maximal distance of 15 000 km.

