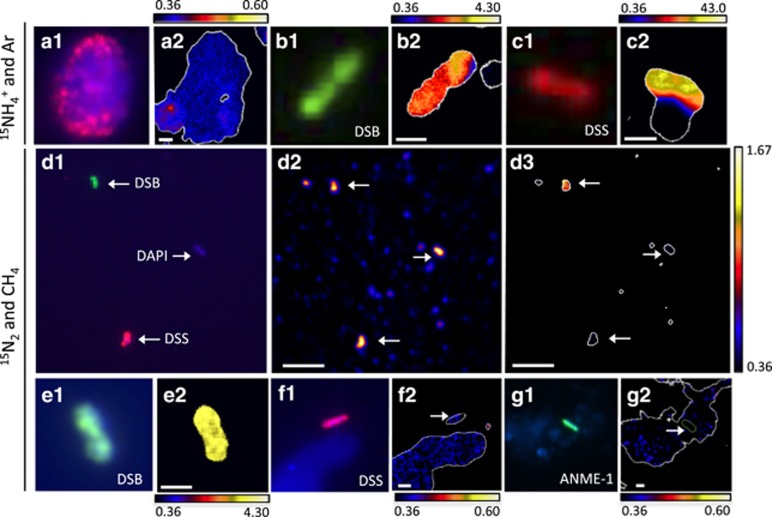
Figure 3.
Paired CARD-FISH and NanoSIMS images of methane seep microorganisms incubated with 15NH4+ and Ar (a–c) or 15N2 and CH4 (d–g). a1, b1, c1, d1, e1, f1, g1: CARD-FISH images show DSB (probe seepDBB_653), DSS (probe DSS_658) and ANME-1 (probe ANME-1_350), counterstained with DAPI (blue) as indicated. (a1) An ANME-2-DSS aggregate with probe DSS_658 in red. a2, b2, c2, d3, e2, f2, g2: NanoSIMS images of the same cells show their isotopic (atom % 15N) composition. (d2) A 12C− ion image of the same cells in (d1 and d3), with 12C− counts ranging from 0 to 900 per pixel. The minimum value for all atom % 15N color bars is natural abundance; the maximum varies by image. The isotope images show data only for pixels that exceed a threshold for total 12C− counts (10–30% of the maximum 12C− counts in the image); these areas are enclosed by white outlines and may include more area compared with the cell of interest because of the presence of non-cellular carbon-containing particles and/or extracellular polymeric substance (EPS). In (g2), the arrow and green outline indicate the location of the cell, which was drawn by hand, and determined using the 12C15N− and 32S− ion images (not shown). Scale bars in (a2, d2 and d3) are 5 μm; all others are 1 μm.

