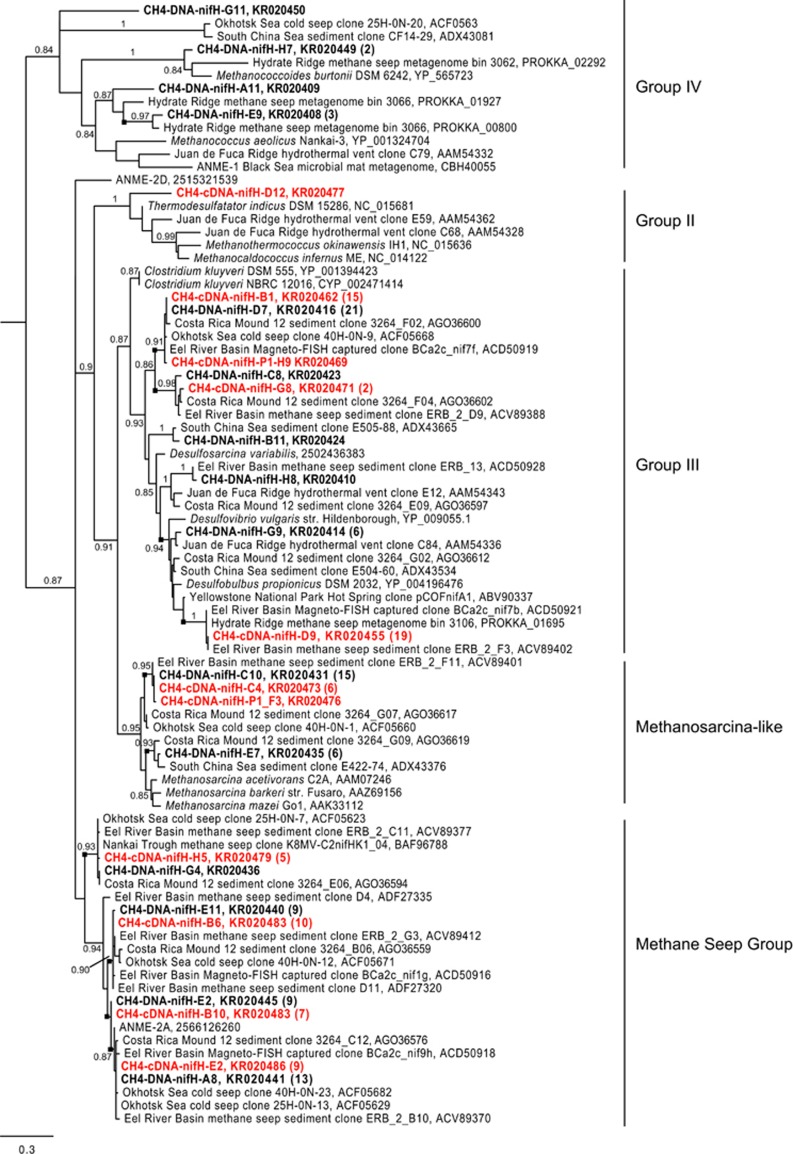
Figure 5.
Translated nifH gene tree inferred with Maximum Likelihood using PhyML 3.0. Sequences from this study are bold. DNA clones are black and cDNA clones are red. For brevity, only a representative subset of the clones from this study is included in the tree. The total number of clones from each library that fall within the group of the clone shown (defined by the last well-supported branch, and indicated by the black square) is included in parentheses. SH-like aLRT (approximate Likelihood Ratio Test) branch supports above 0.70 for major branches are shown. The scale bar indicates the average number of amino acid substitutions per site. The tree was rooted with chlorophyllide reductase gene sequences YP_004716603, YP_680532, YP_001534851, and YP_508121. NCBI accession numbers are shown when possible; the IMG Gene IDs are listed for ANME-2D, ANME-2 A, and Desulfosarcina variabilis. nifH groups as described by Raymond et al., 2004 are indicated.

