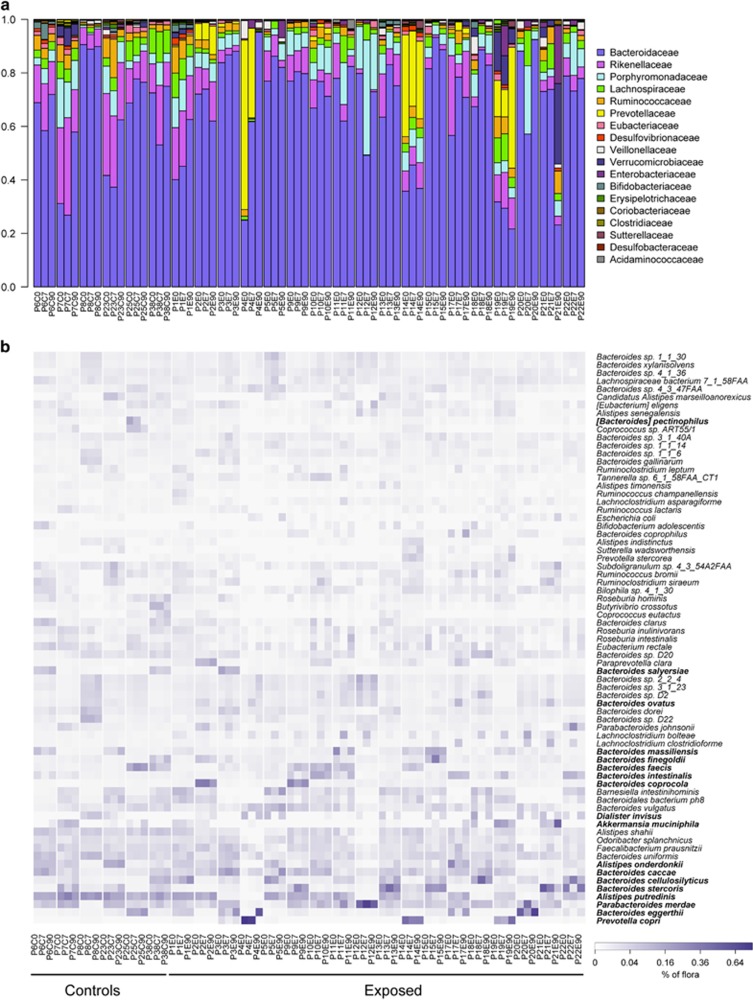
Figure 1.
Composition of bacterial communities in all participants before exposure, 7 days later and 90 days after exposure to cefprozil. (a) Bar plot representing the relative abundance of bacterial families in controls and exposed participants. (b) Heat map representing the relative abundance of bacterial species that constituted >1% of the community in at least one participant. Species are grouped based on hierarchical clustering. Species in bold are the most abundant in at least one microbiome. P precedes the identification number of the participant, E indicates exposed and C indicates control.

