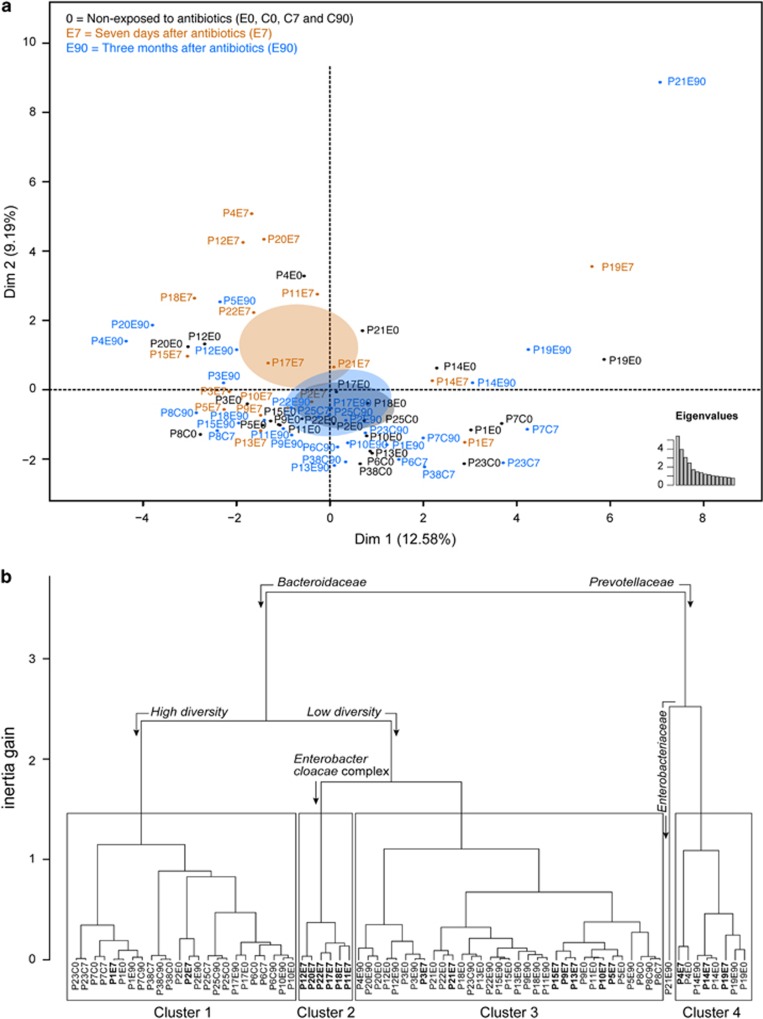
Figure 2.
MFA reveals the effect of cefprozil on the microbiome of healthy individuals. MFA was performed using 11 variable groups representing data of taxonomic profiling, abundance of resistance genes or mobile elements, diversity indices, sequencing depth and assembly statistics. (a) The factorial map presents the impact of exposure to antibiotics on the microbial flora of participants based on the MFA. Black identifiers and ellipses indicate samples non-exposed to the antibiotic (E0, C0, C7 and C90), tan samples taken at the end of the antibiotic treatment (E7) and blue samples taken 90 days after the end of the treatment (E90). The ellipses represent the barycentre of the sample groups with 95% confidence. Eigenvalues show the significance of dimensions 1 and 2. (b) Hierarchical clustering based on results from the MFA. Four clusters are identified, along with a singleton sample. The quantitative variables driving the separation of samples in the clustering are indicated by bent arrows over the dendrogram. Association of microbiome characteristics with clusters was undertaken using an F-test in a one-way analysis of variance. Samples at E7 are in bold to emphasis the clustering of exposed participants.

