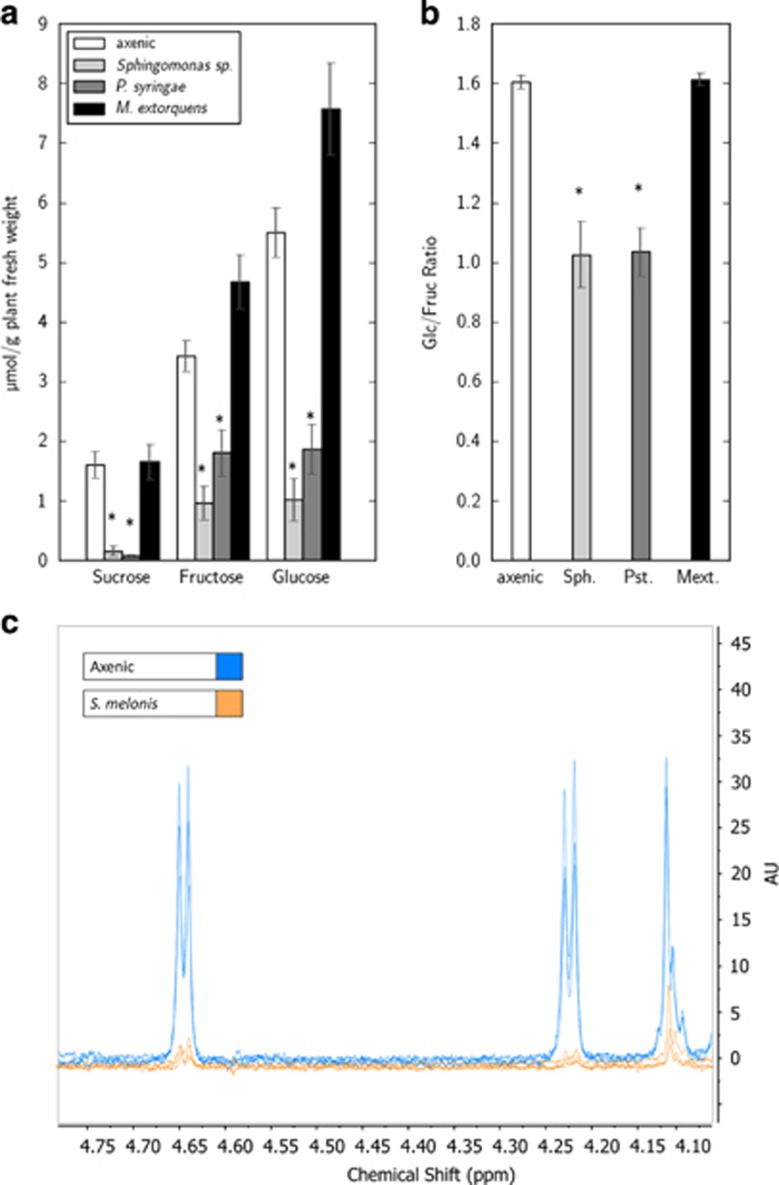
Figure 1.
Substrate quantities as determined by NMR in dependence on bacterial colonizations. Absolute quantities are shown in panel (a). Monosaccharide pool ratios given in panel (b) show a clear alteration by leaf colonization of potentially glycolytic strains (calculated as the average of ratios of all samples of a treatment individually). Abbreviations used here and typical colonization density reached at the time of experiments (CFU per gram plant fresh weight): Sph.: S. melonis Fr1 (2 × 10⁸), Pst.: P. syringae pv. tomato DC3000 (5 × 10⁸), Mext.: M. extorquens PA1 (8 × 10⁷). Bars represent the mean of at least four replicates each with standard errors of the mean shown as error bars. Asterisks signify t-test-derived P-values below 0.05. Panel (c) shows exemplary 1H-NMR spectra excerpts from three axenic (blue) and S. melonis (yellow) phylloplane wash extracts, with clearly visible anomeric proton peaks of glucose (doublet at 4.62 p.p.m.) and sucrose (doublet at 4.22 p.p.m.). The rightmost quadruplet belongs to fructose.

