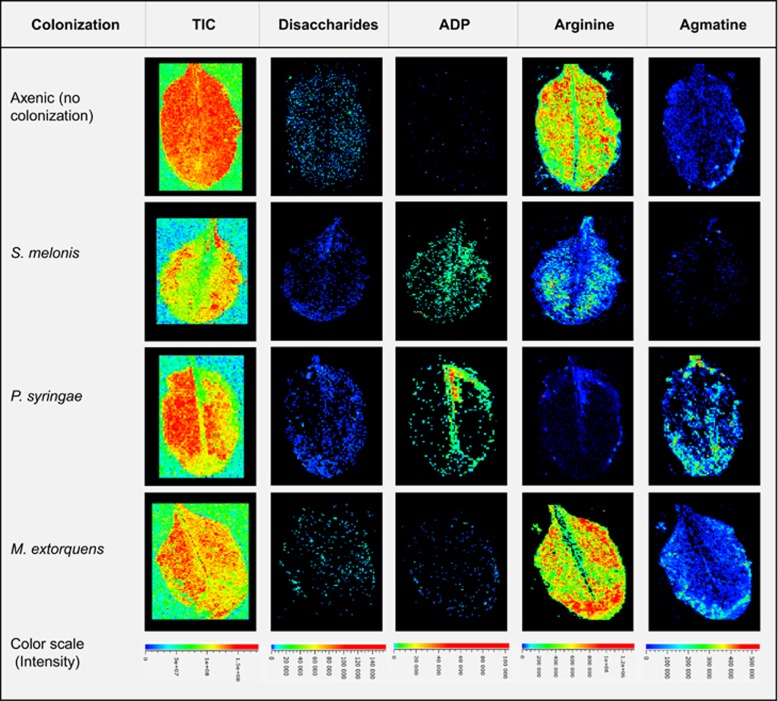
Figure 3.
Examples of phylloplane mass slice images (MALDI-IMS) plus the total ion current image (TIC) in the left-hand image series, showing heterogeneous distributions of potential substrates and bacterial metabolites, with ion counts encoded by false colors. The color scales shown at the bottom have been unified for each metabolite image series (i.e., columns), but not for the individual treatments (i.e., rows).

