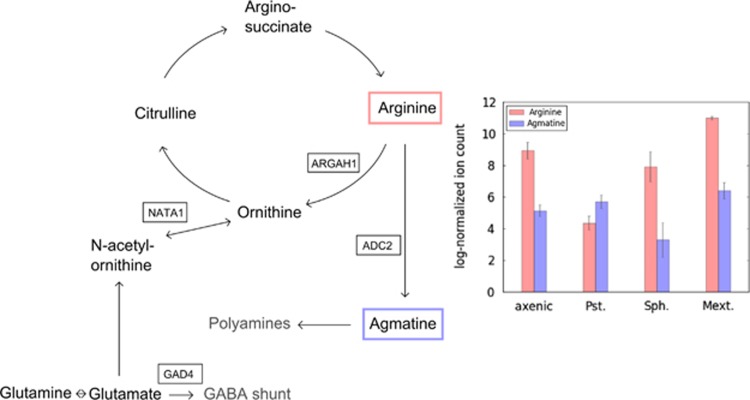
Figure 4.
Phylloplane compounds implicated in arginine metabolism, which show colonization specific pool changes as determined by IMS. Genes shown in boxes have been reported as strongly upregulated after P. syringae infection in literature (Zimmermann et al., 2008; Adio et al., 2011). The bar plot on the right hand side shows the varying levels of arginine and agmatine for all the colonization treatments. Bars represent the mean of three replicates each with standard errors of the mean shown as error bars. Abbreviations used here for the different bacterial strains are: Pst., P. syringae pv. tomato; Sph., S. melonis; Mext., M. extorquens.

