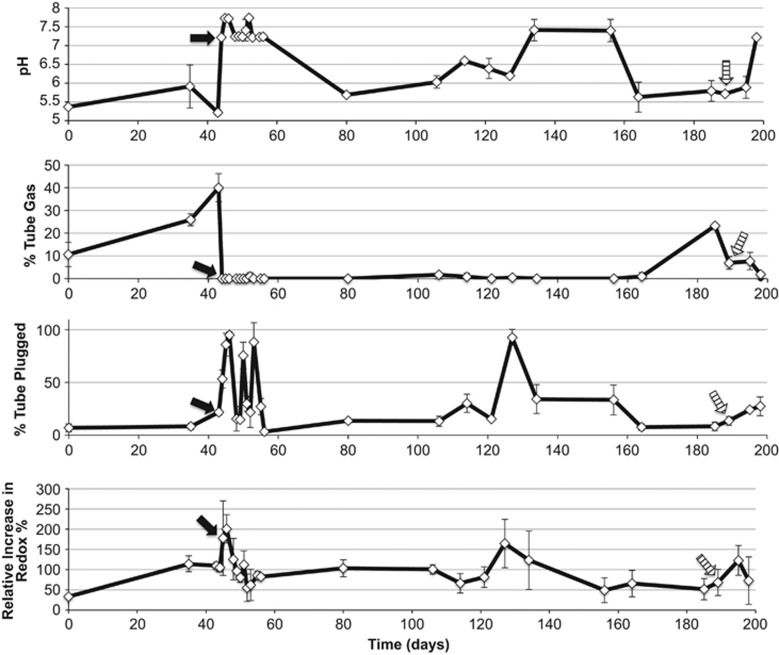
Figure 3.
Fluctuations in WinCF model variables through two separate exacerbation events in a single CF patient. Quantitative MATLAB output of the images is plotted through time where each point represents a sputum sample. Arrows in the plot indicate where antibiotics were administered for an exacerbation, the black arrow was intravenous and the striped arrow was oral administration of antibiotics.

