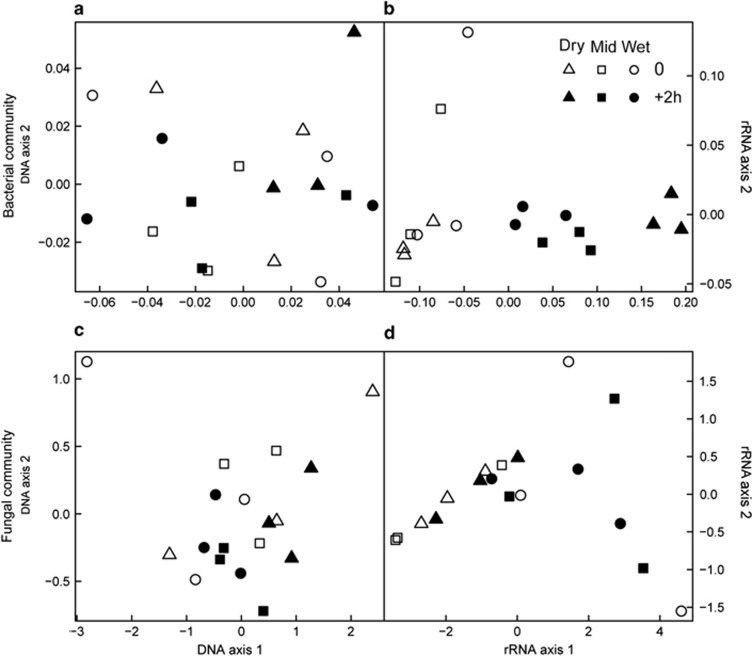
Figure 2.
Principal coordinates analysis (PCoA) of the UniFrac pairwise dissimilarity of the relative abundance of bacterial and fungal pyrotag sequences, based on 16S rRNA gene (a) and 16S rRNA (b) for bacteria and on 28S rRNA gene (c) and 28S rRNA (d) for fungi, before (open symbols) and 2 h after wet-up (closed symbols) in the three precipitation pattern treatments (Dry: no water input, triangles; Mid: weekly water inputs for 2 months followed by no input, squares; Wet: weekly water inputs, circles).

