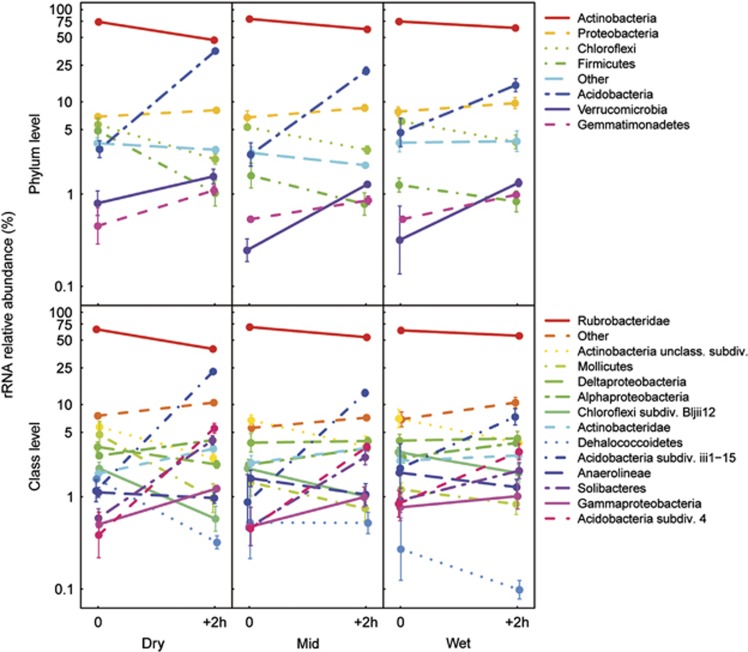
Figure 3.
Relative abundance of potentially active bacterial phyla (>1%), based on 16S rRNA sequenced before and 2 h after wet-up in the three precipitation pattern treatments (Dry: no water input, Mid: weekly water inputs for 2 months followed by no input, Wet: weekly water inputs). Bars indicate ±1s.e.

