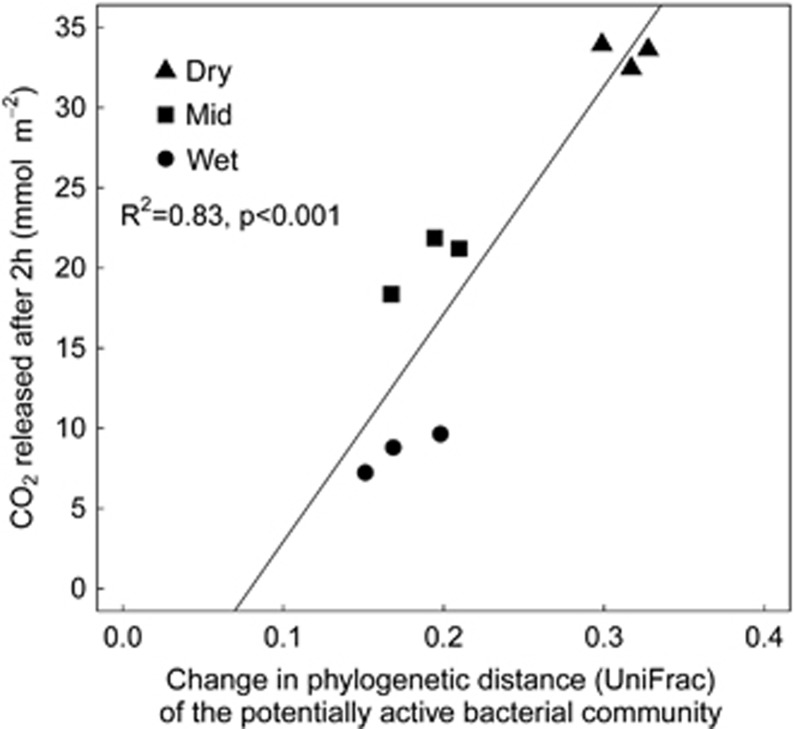
Figure 7.
Relation between changes in community structure (abundance-weighted UniFrac phylogenetic distance) of the potentially active soil bacteria and the amount of CO2 emitted from the soil, two hours after rewetting soil from the three precipitation pattern treatments (Dry: no water input, triangles; Mid: weekly water inputs for 2 months followed by no input, squares; Wet: weekly water inputs, circles).

